数据来自Seutat官方教程
读取数据
1
2
3
| library(Seurat)
library(tidyverse)
library(patchwork)
|
1
2
3
| pbmc.data <- Read10X('filtered_gene_bc_matrices/hg19') # barcodes.tsv, genes.tsv, matrix.mtx三个文件所在文件夹的路径
pbmc <- CreateSeuratObject(counts = pbmc.data, project = 'pbmc3k', min.cells = 3, min.features = 200)
pbmc
|
细胞过滤
1
2
| # 计算线粒体的比例
pbmc[['percent.mt']] <- PercentageFeatureSet(pbmc, pattern = '^MT-') # 数据保存在 pbmc@meta.data
|
1
2
3
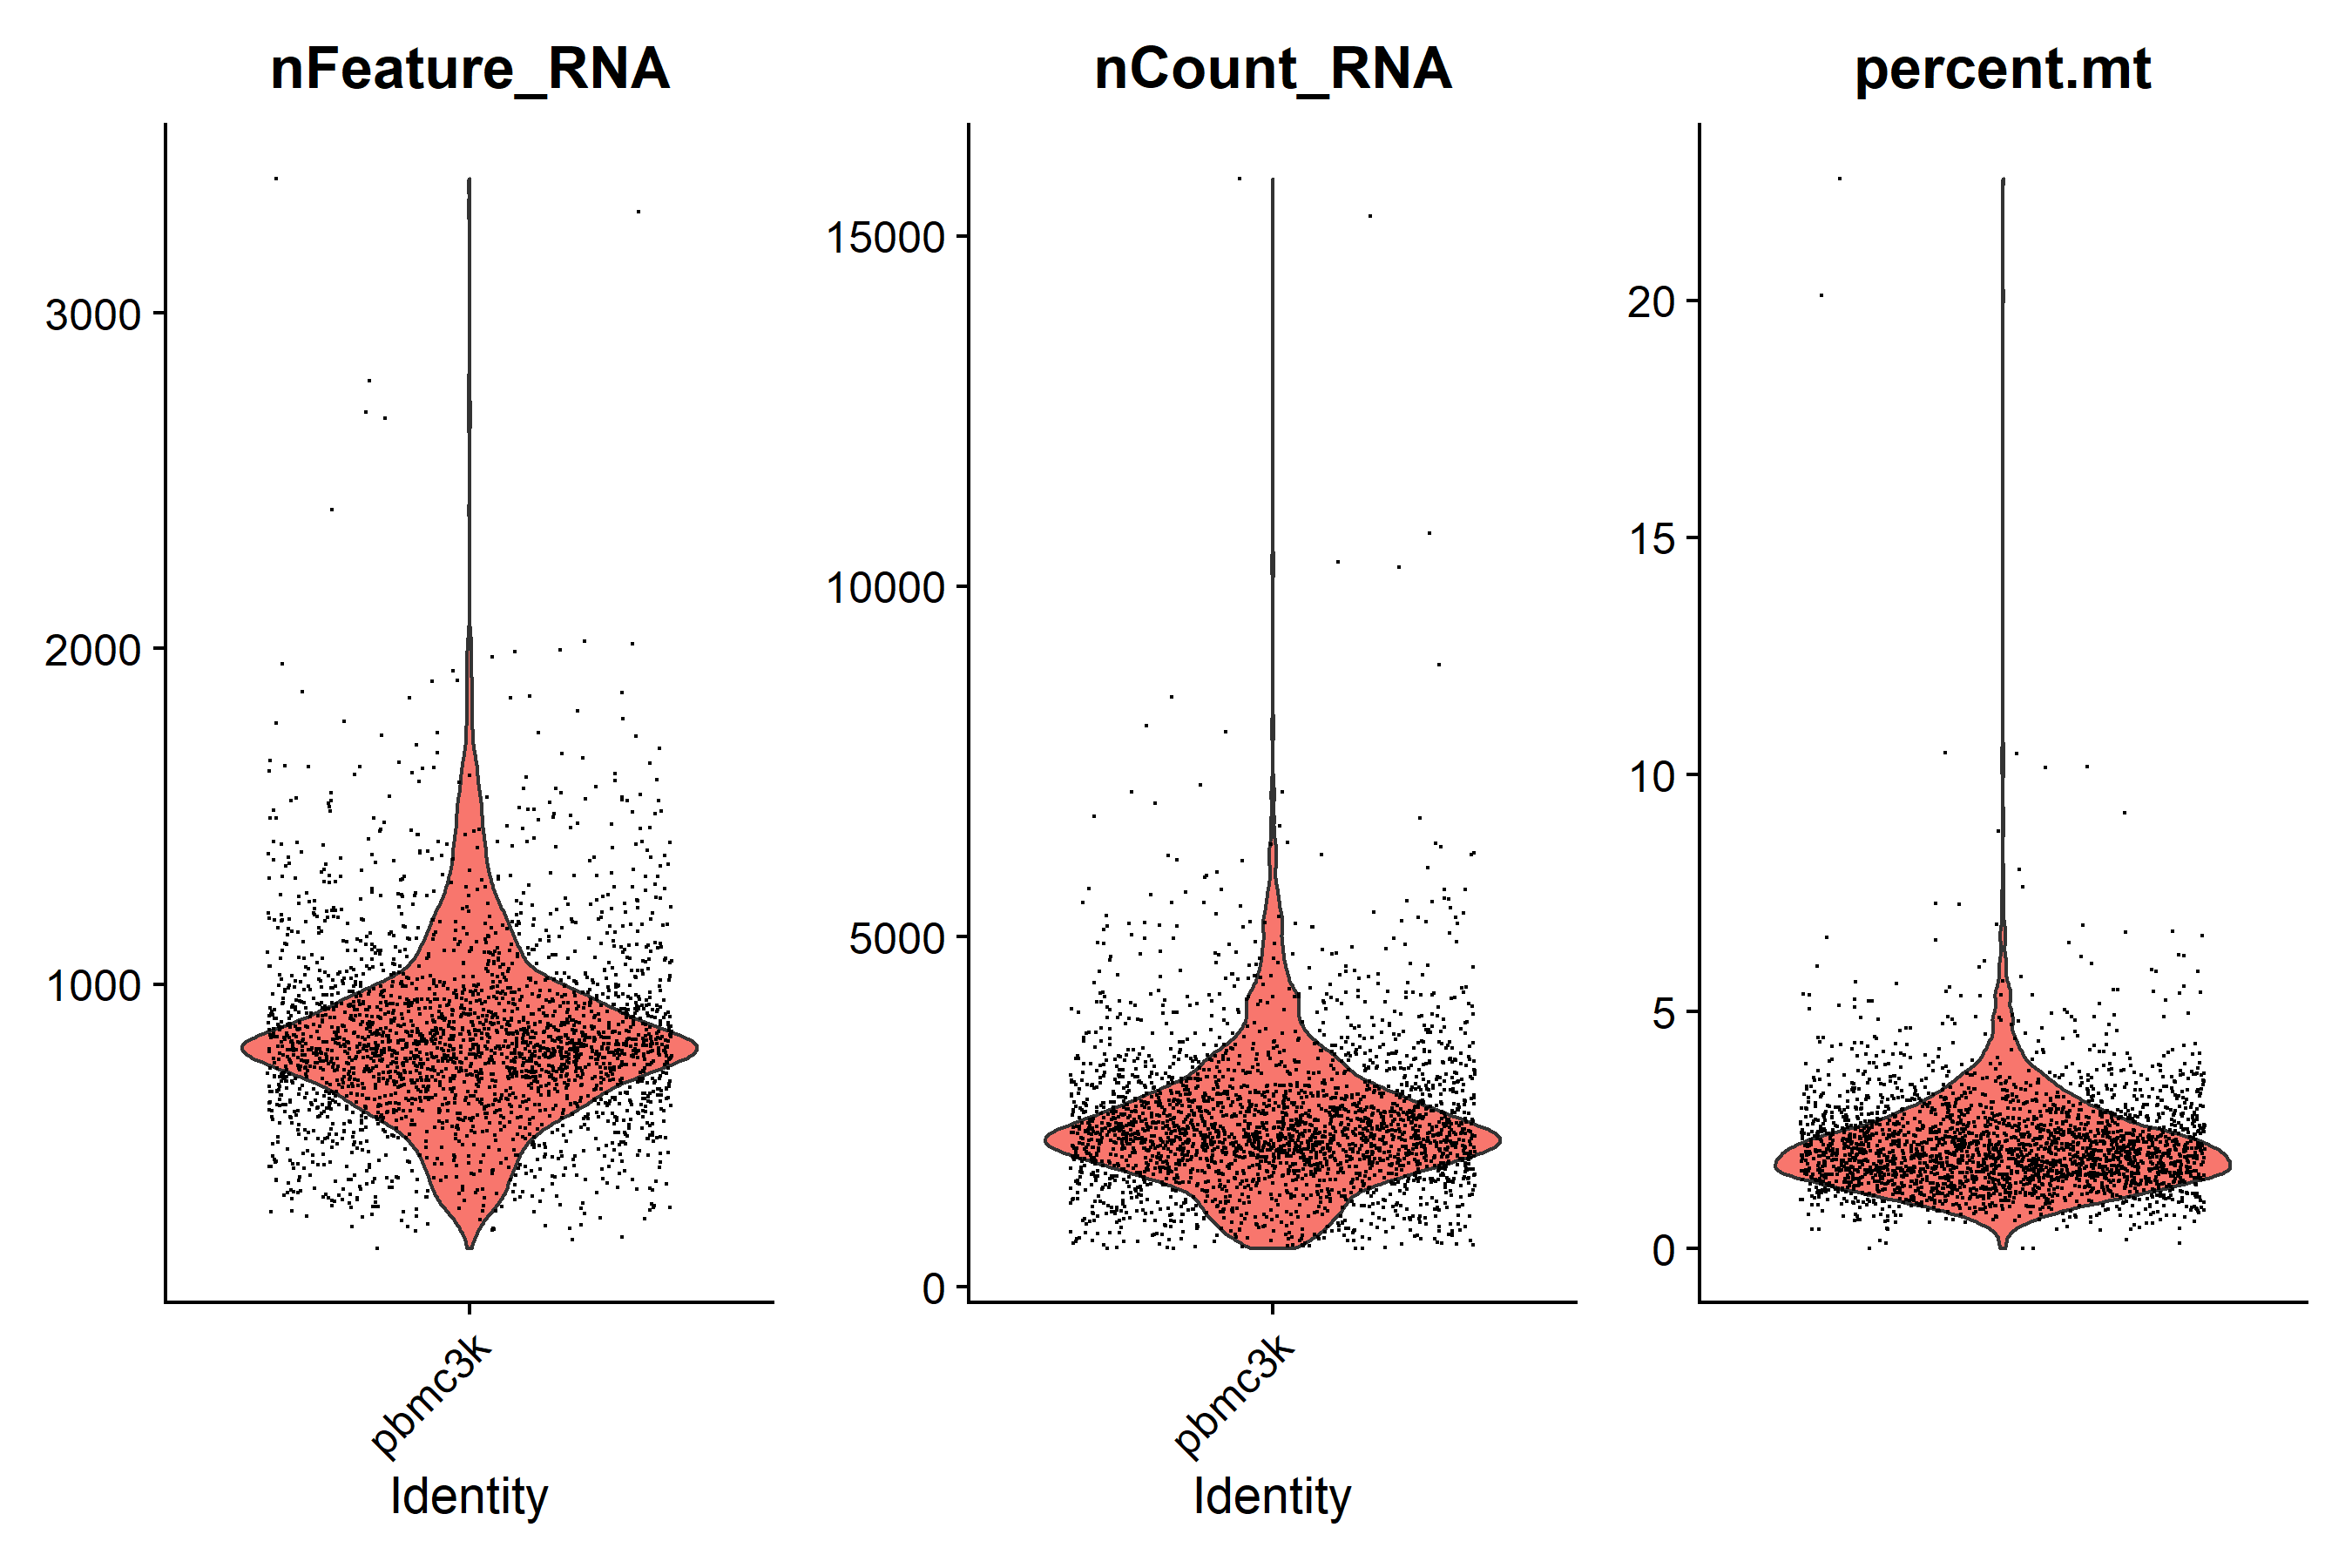
| violin <- VlnPlot(pbmc, features = c('nFeature_RNA', 'nCount_RNA', 'percent.mt'), ncol = 3) + theme(axis.title.x = element_blank(), axis.text.x = element_blank(), axis.ticks.x = element_blank())
ggsave('QC/vlnplot_before_qc.pdf', plot = violin, width = 9, height = 6)
ggsave('QC/vlnplot_before_qc.png', plot = violin, width = 9, height = 6)
|

1
2
3
4
5
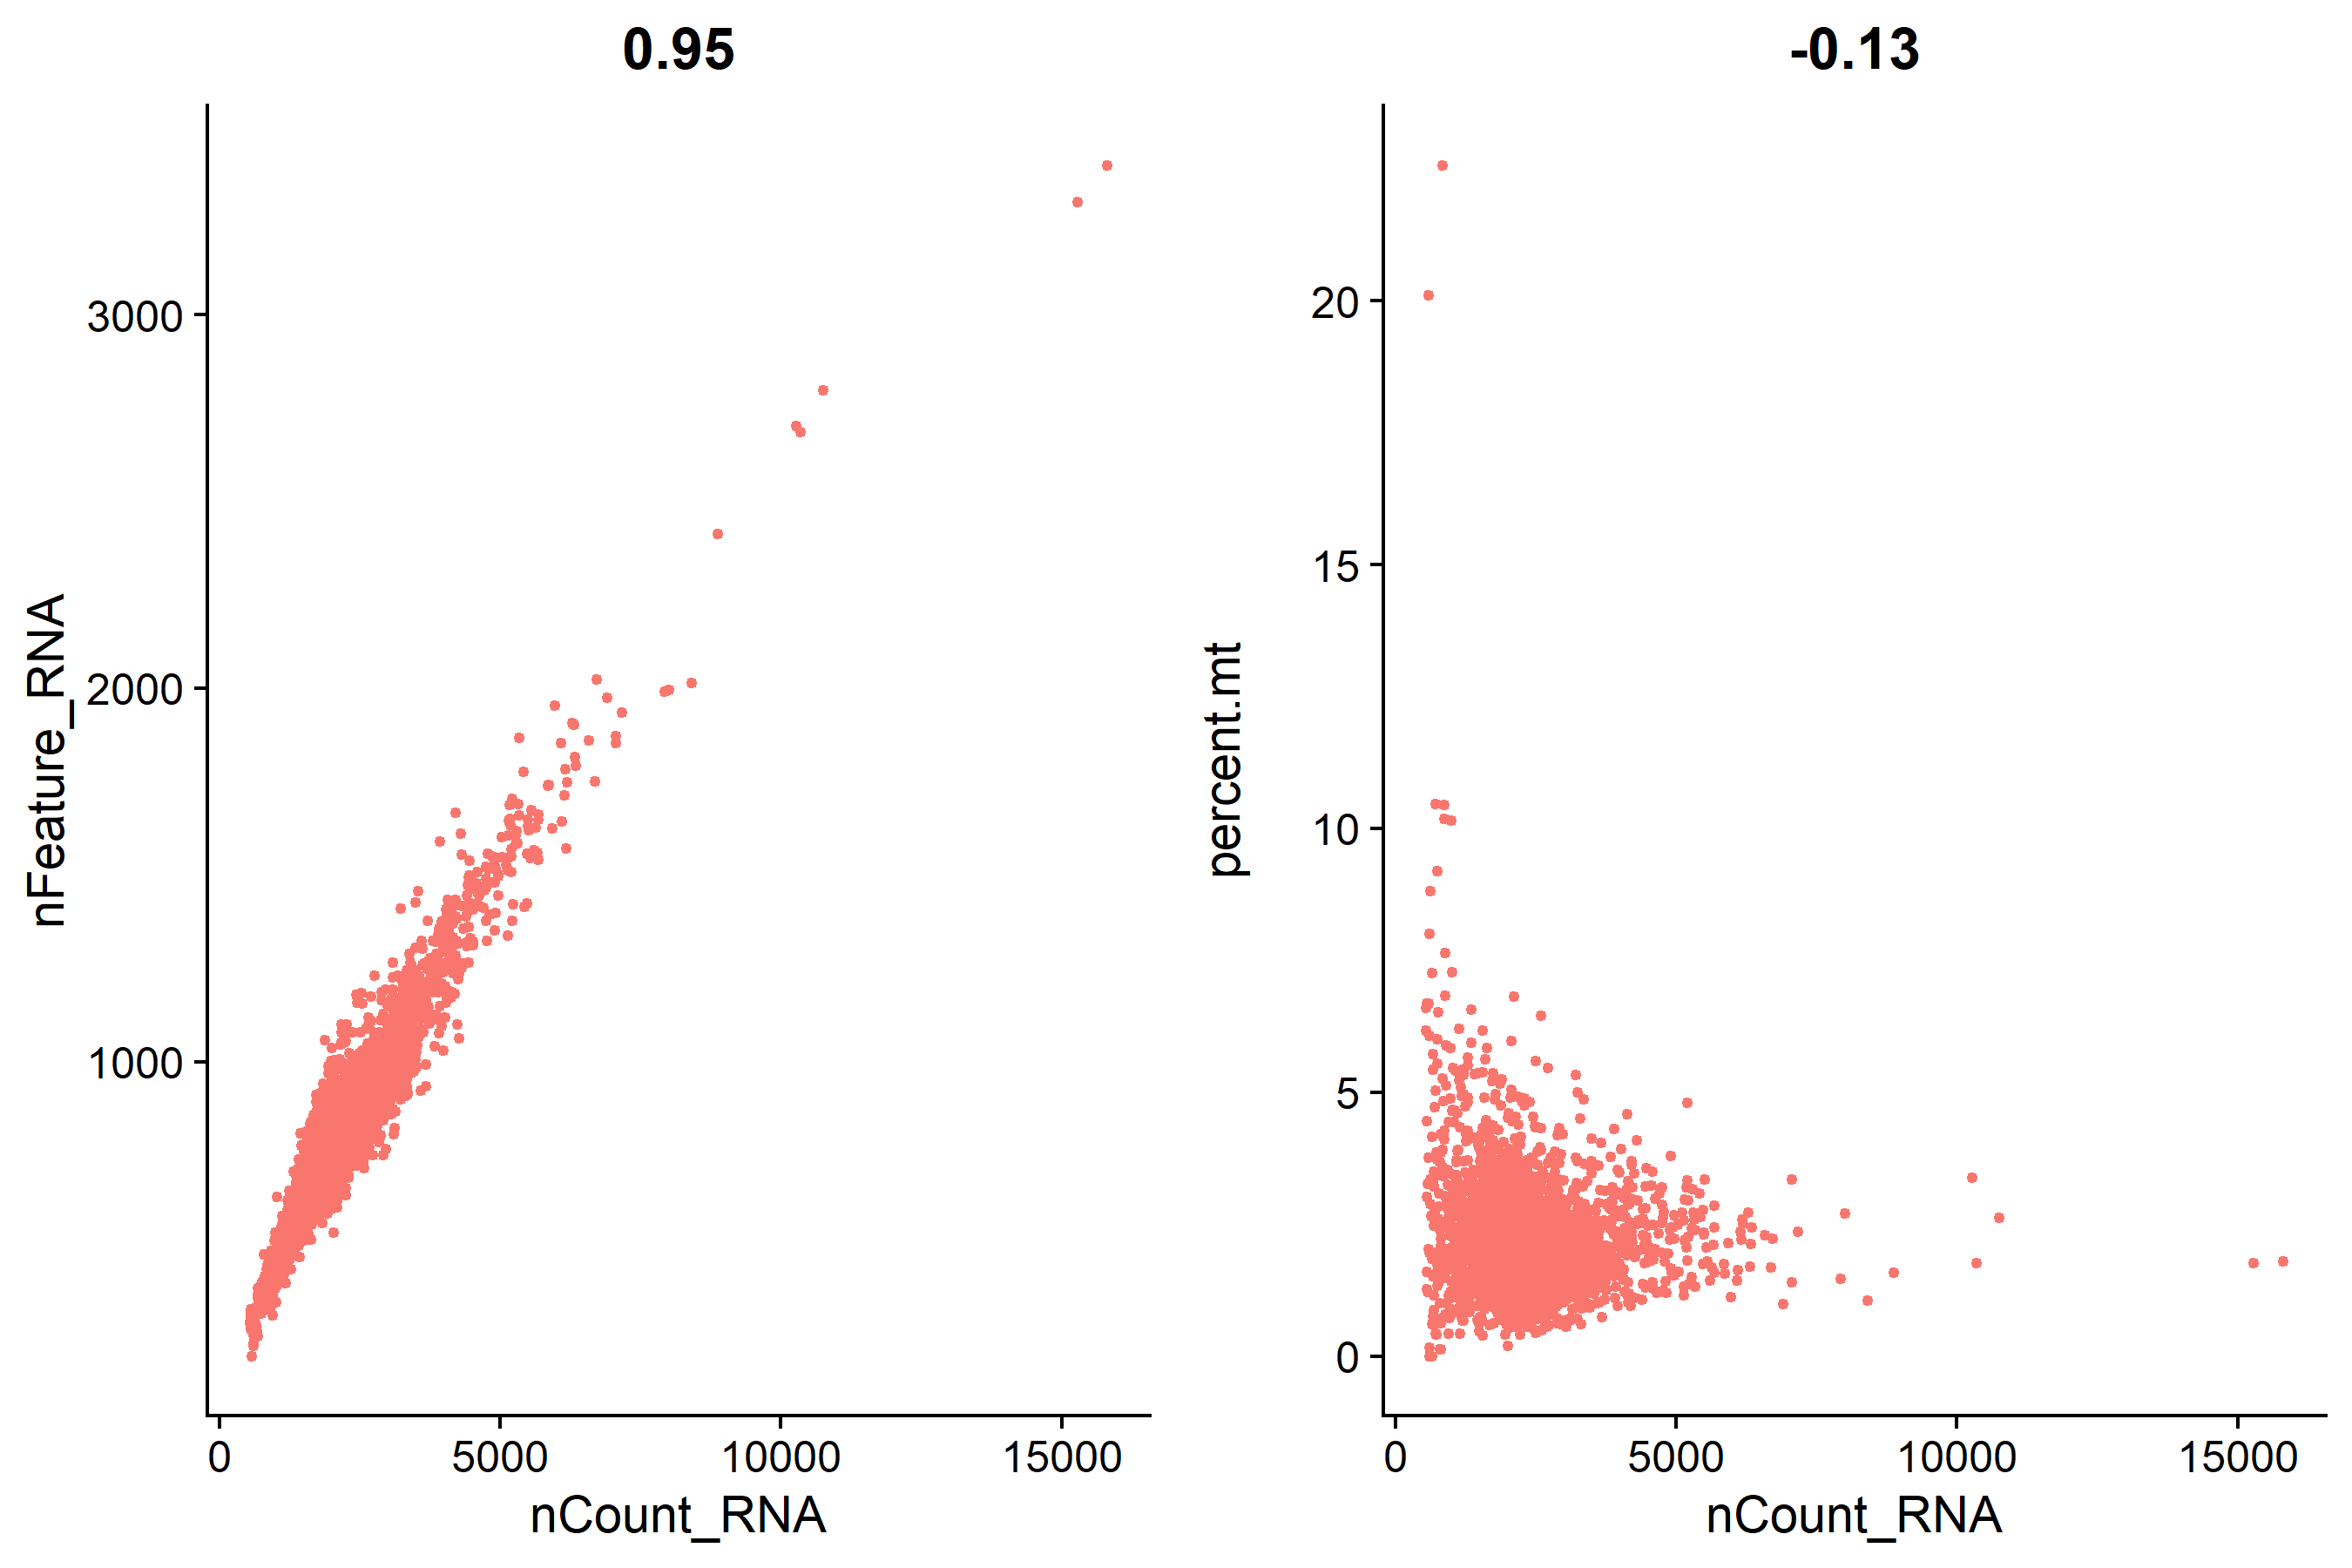
| plot1 <- FeatureScatter(pbmc, feature1 = 'nCount_RNA', feature2 = 'nFeature_RNA')
plot2 <- FeatureScatter(pbmc, feature1 = 'nCount_RNA', feature2 = 'percent.mt')
scatter <- CombinePlots(plots = list(plot1, plot2), nrow = 1, legend = 'none')
ggsave('QC/scatterplot_before_qc.pdf', plot = scatter, width = 9, height = 6)
ggsave('QC/scatterplot_before_qc.png', plot = scatter, width = 9, height = 6)
|

1
2
3
4
5
6
7
8
9
10
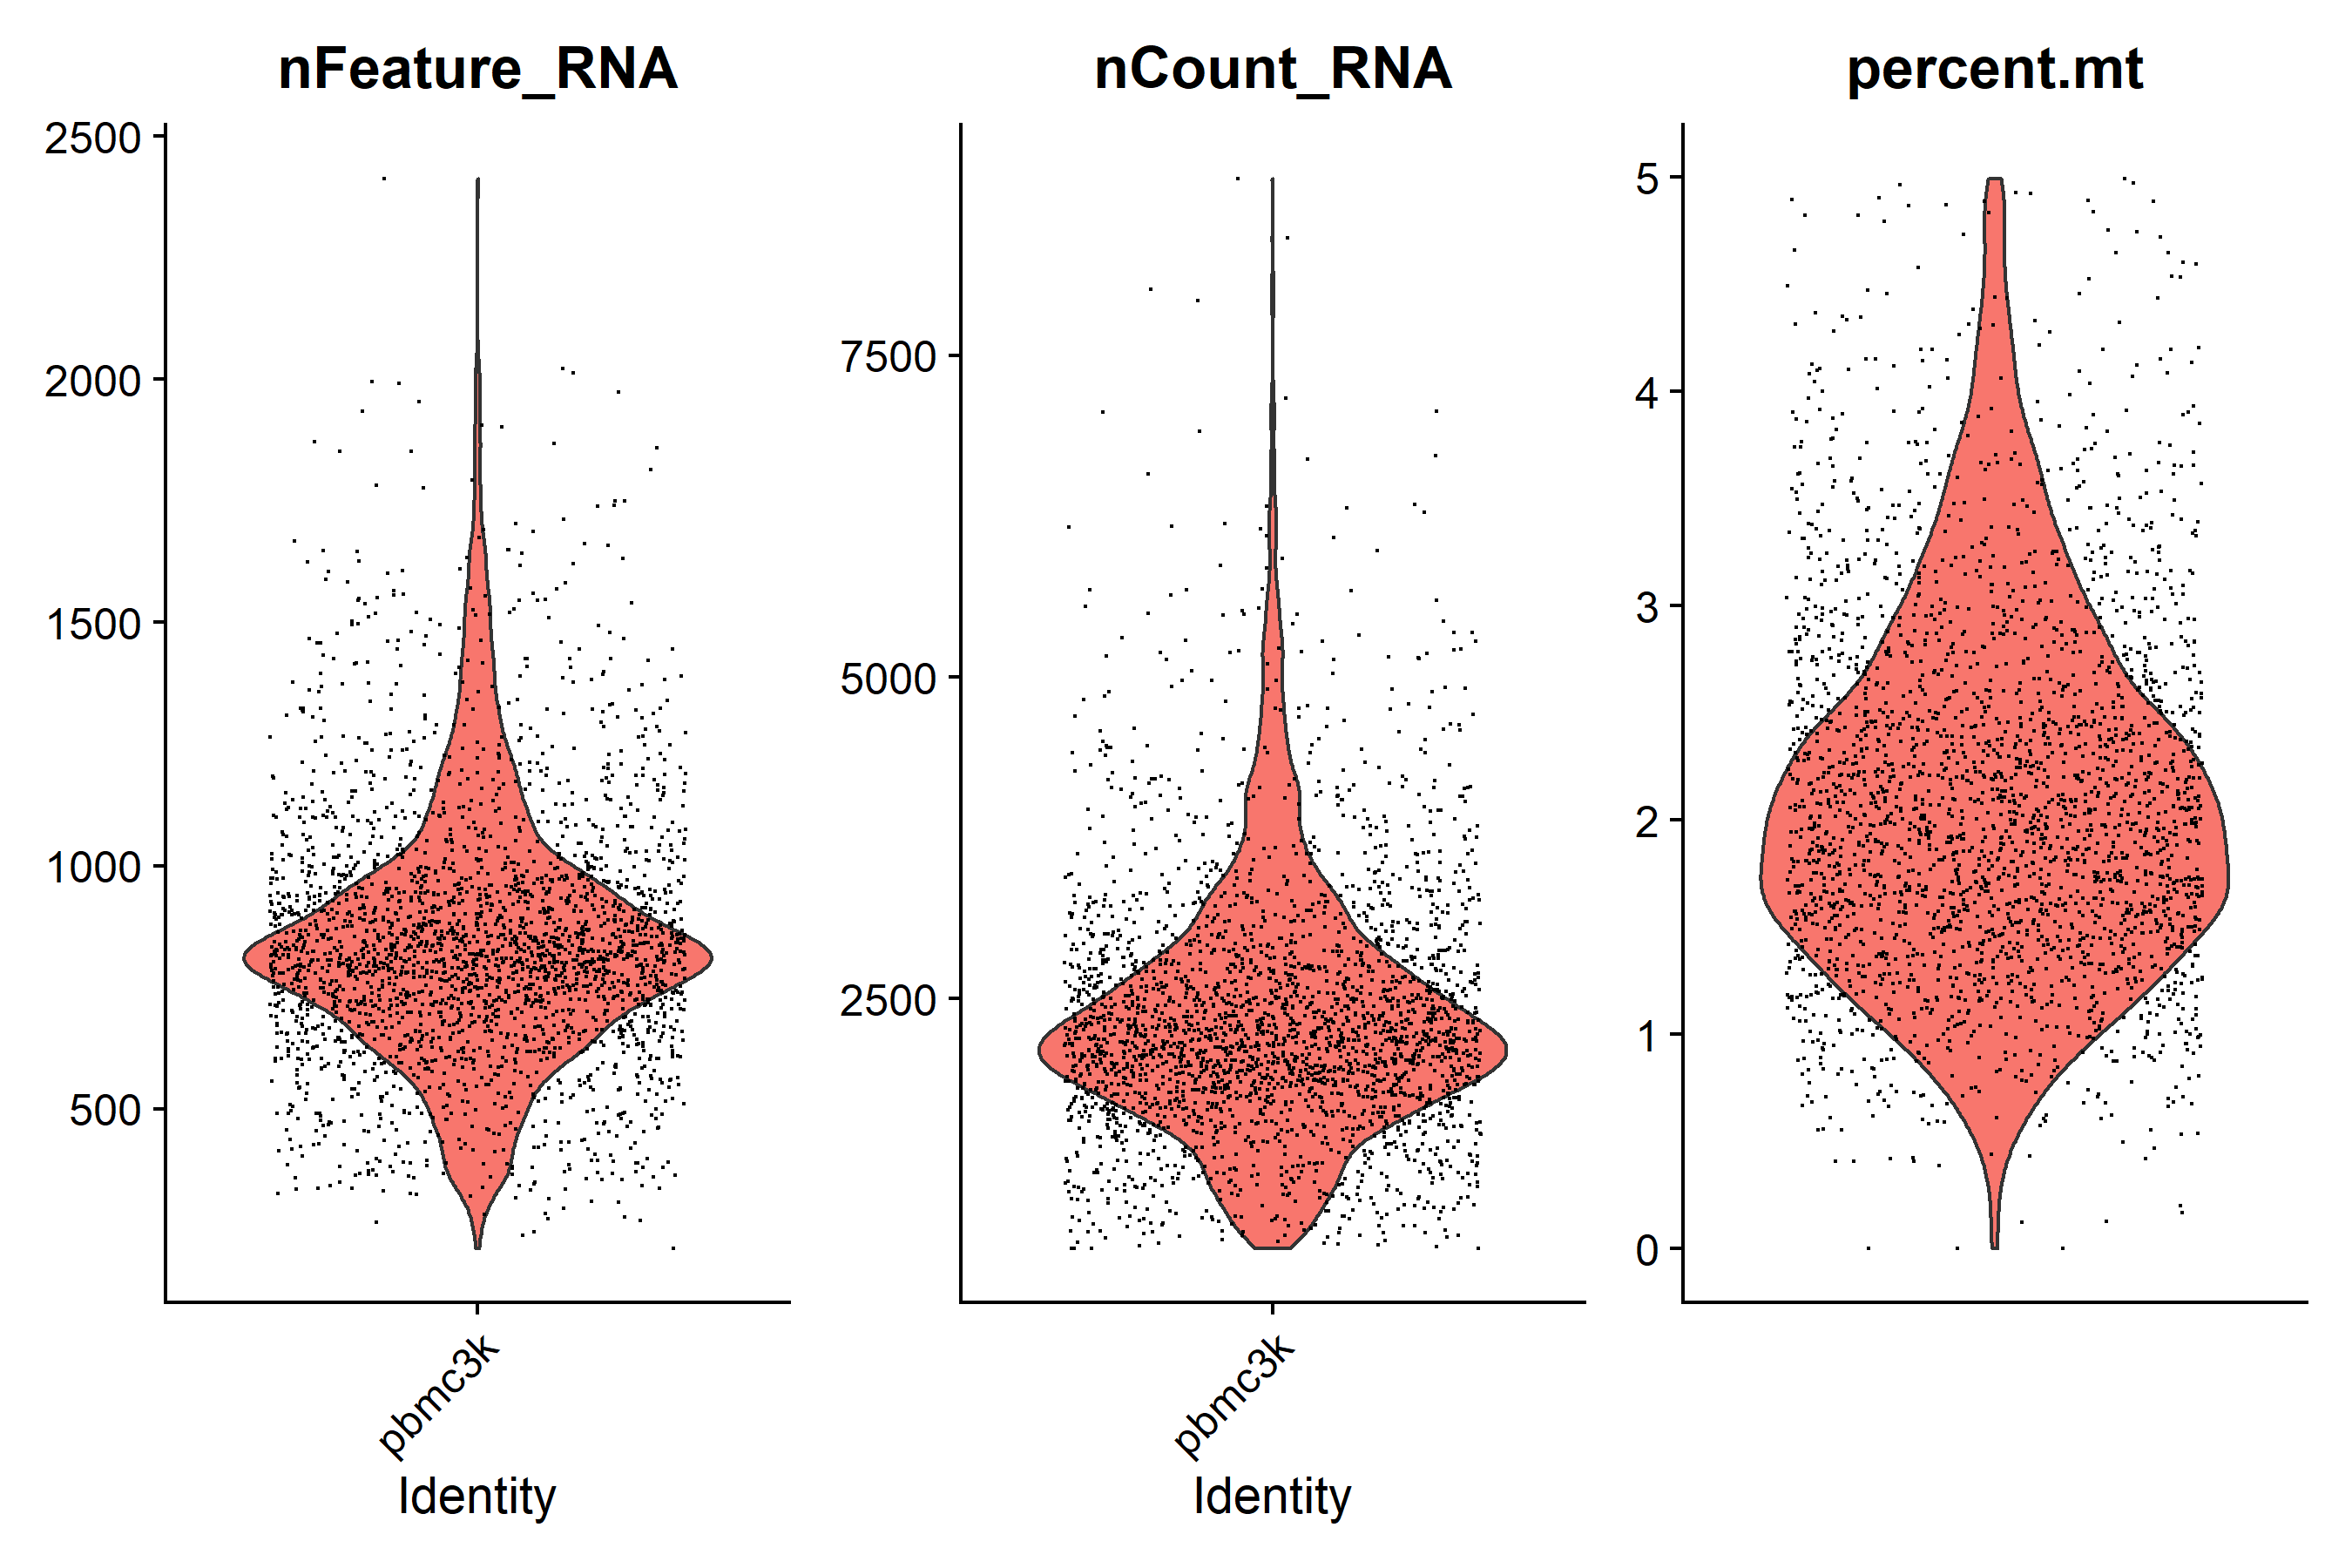
| # 根据小提琴图设置过滤标准
minGene = 200 # 一般选择200-500
maxGene = 2500
pctMT = 5
pbmc <- subset(pbmc, subset = nFeature_RNA > minGene & nFeature_RNA < maxGene & percent.mt < pctMT)
violin <- VlnPlot(pbmc, features = c('nFeature_RNA', 'nCount_RNA', 'percent.mt'), ncol = 3) + theme(axis.title.x = element_blank(), axis.text.x = element_blank(), axis.ticks.x = element_blank())
ggsave('QC/vlnplot_after_qc.pdf', plot = violin, width = 9, height = 6)
ggsave('QC/vlnplot_after_qc.png', plot = violin, width = 9, height = 6)
|

数据标准化
1
| pbmc <- NormalizeData(pbmc, normalization.method = 'LogNormalize', scale.factor = 10000)
|
寻找高变基因
1
2
3
4
5
6
7
8
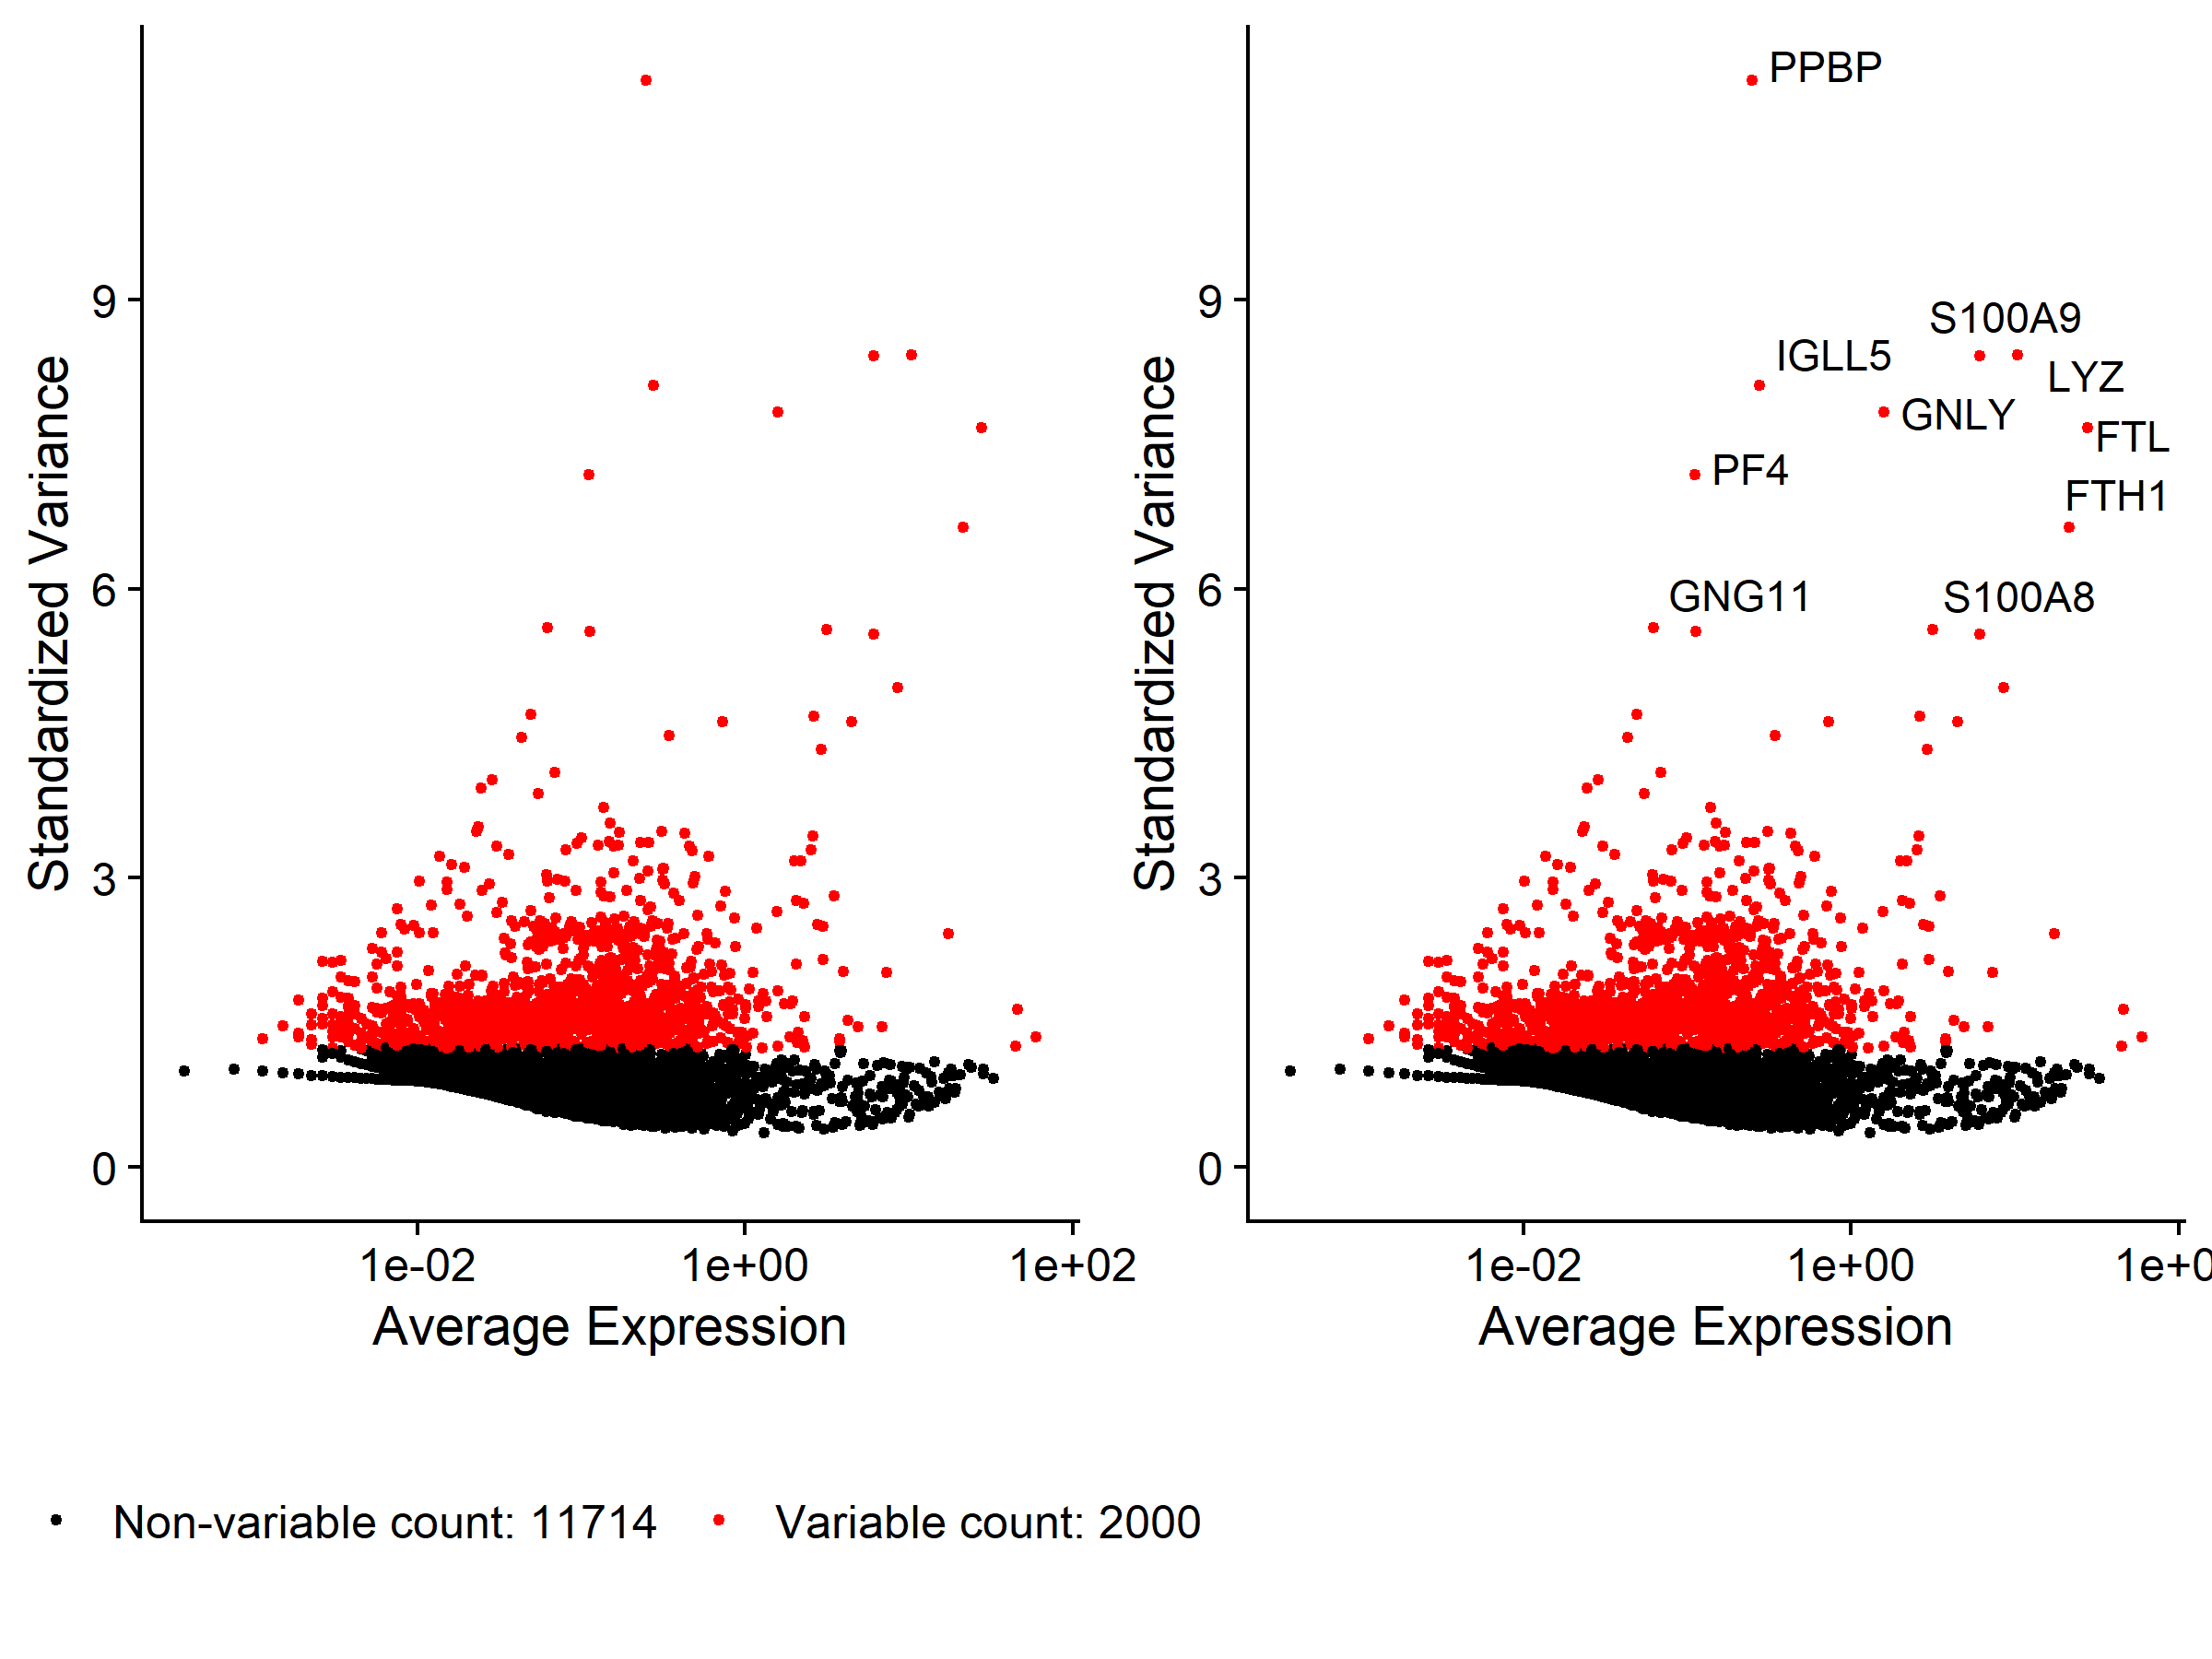
| pbmc <- FindVariableFeatures(pbmc, selection.method = 'vst', nfeatures = 2000)
top10 <- head(VariableFeatures(pbmc), 10)
plot1 <- VariableFeaturePlot(pbmc)
plot2 <- LabelPoints(plot = plot1, points = top10, repel = TRUE)
plot <- CombinePlots(plots = list(plot1, plot2), legend = 'bottom')
ggsave('cluster/VariableFeatures.pdf', plot = plot, width = 8, height = 6)
ggsave('cluster/VariableFeatures.png', width = 8, height = 6)
|

数据缩放
1
2
3
4
5
6
7
| # 如果内存足够,对所有基因进行缩放
## all.genes <- rownames(pbmc)
## pbmc <- ScaleData(pbmc, features = all.genes)
# 如果内存不够,只对高变基因进行缩放
scale.genes <- VariableFeatures(pbmc)
pbmc <- ScaleData(pbmc, features = scale.genes)
|
PCA线性降维
1
2
3
4
5
6
7
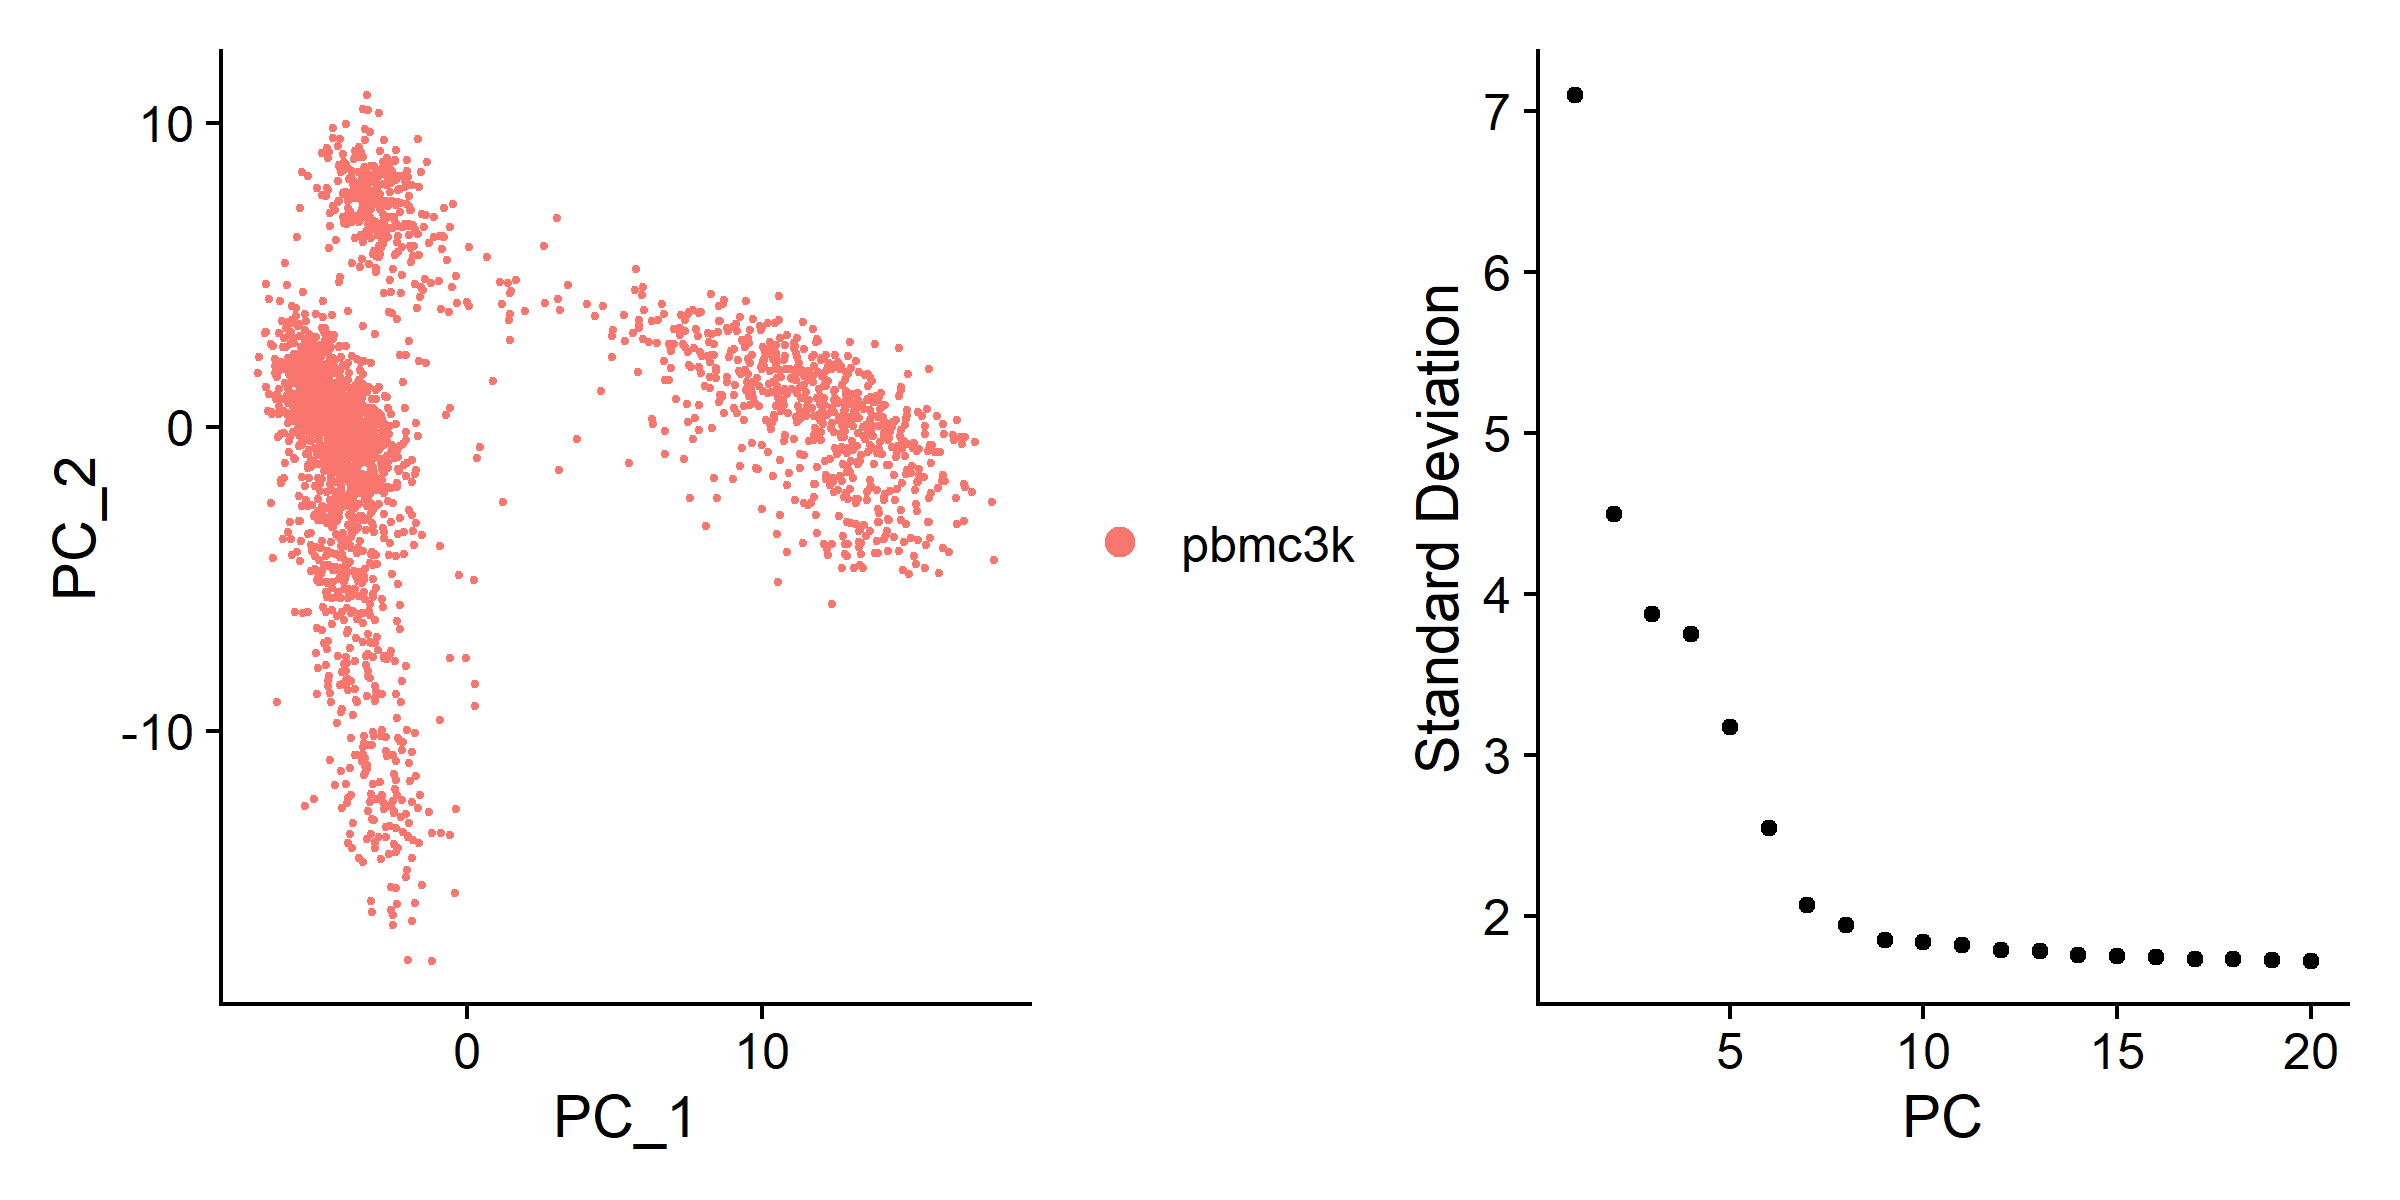
| pbmc <- RunPCA(pbmc, features = VariableFeatures(pbmc))
plot1 <- DimPlot(pbmc, reduction = 'pca')
plot2 <- ElbowPlot(pbmc, ndims = 20, reduction = 'pca')
plot <- plot1 + plot2
ggsave('cluster/pca.pdf', plot = plot, width = 8, height = 4)
ggsave('cluster/pca.png', plot = plot, width = 8, height = 4)
|

细胞聚类
1
2
3
4
5
6
7
8
| pc.num = 1:10
pbmc <- FindNeighbors(pbmc, dims = pc.num)
pbmc <- FindClusters(pbmc, resolution = 0.5)
metadata <- pbmc@meta.data
cell_cluster <- data.frame(cell_ID = rownames(metadata), cluster_ID = metadata$seurat_clusters)
write.csv(cell_cluster, 'cluster/cell_cluster.csv', row.names = F)
|
非线性降维
1
2
3
4
5
6
7
8
9
10
11
12
13
14
15
16
17
18
19
| # tSNE
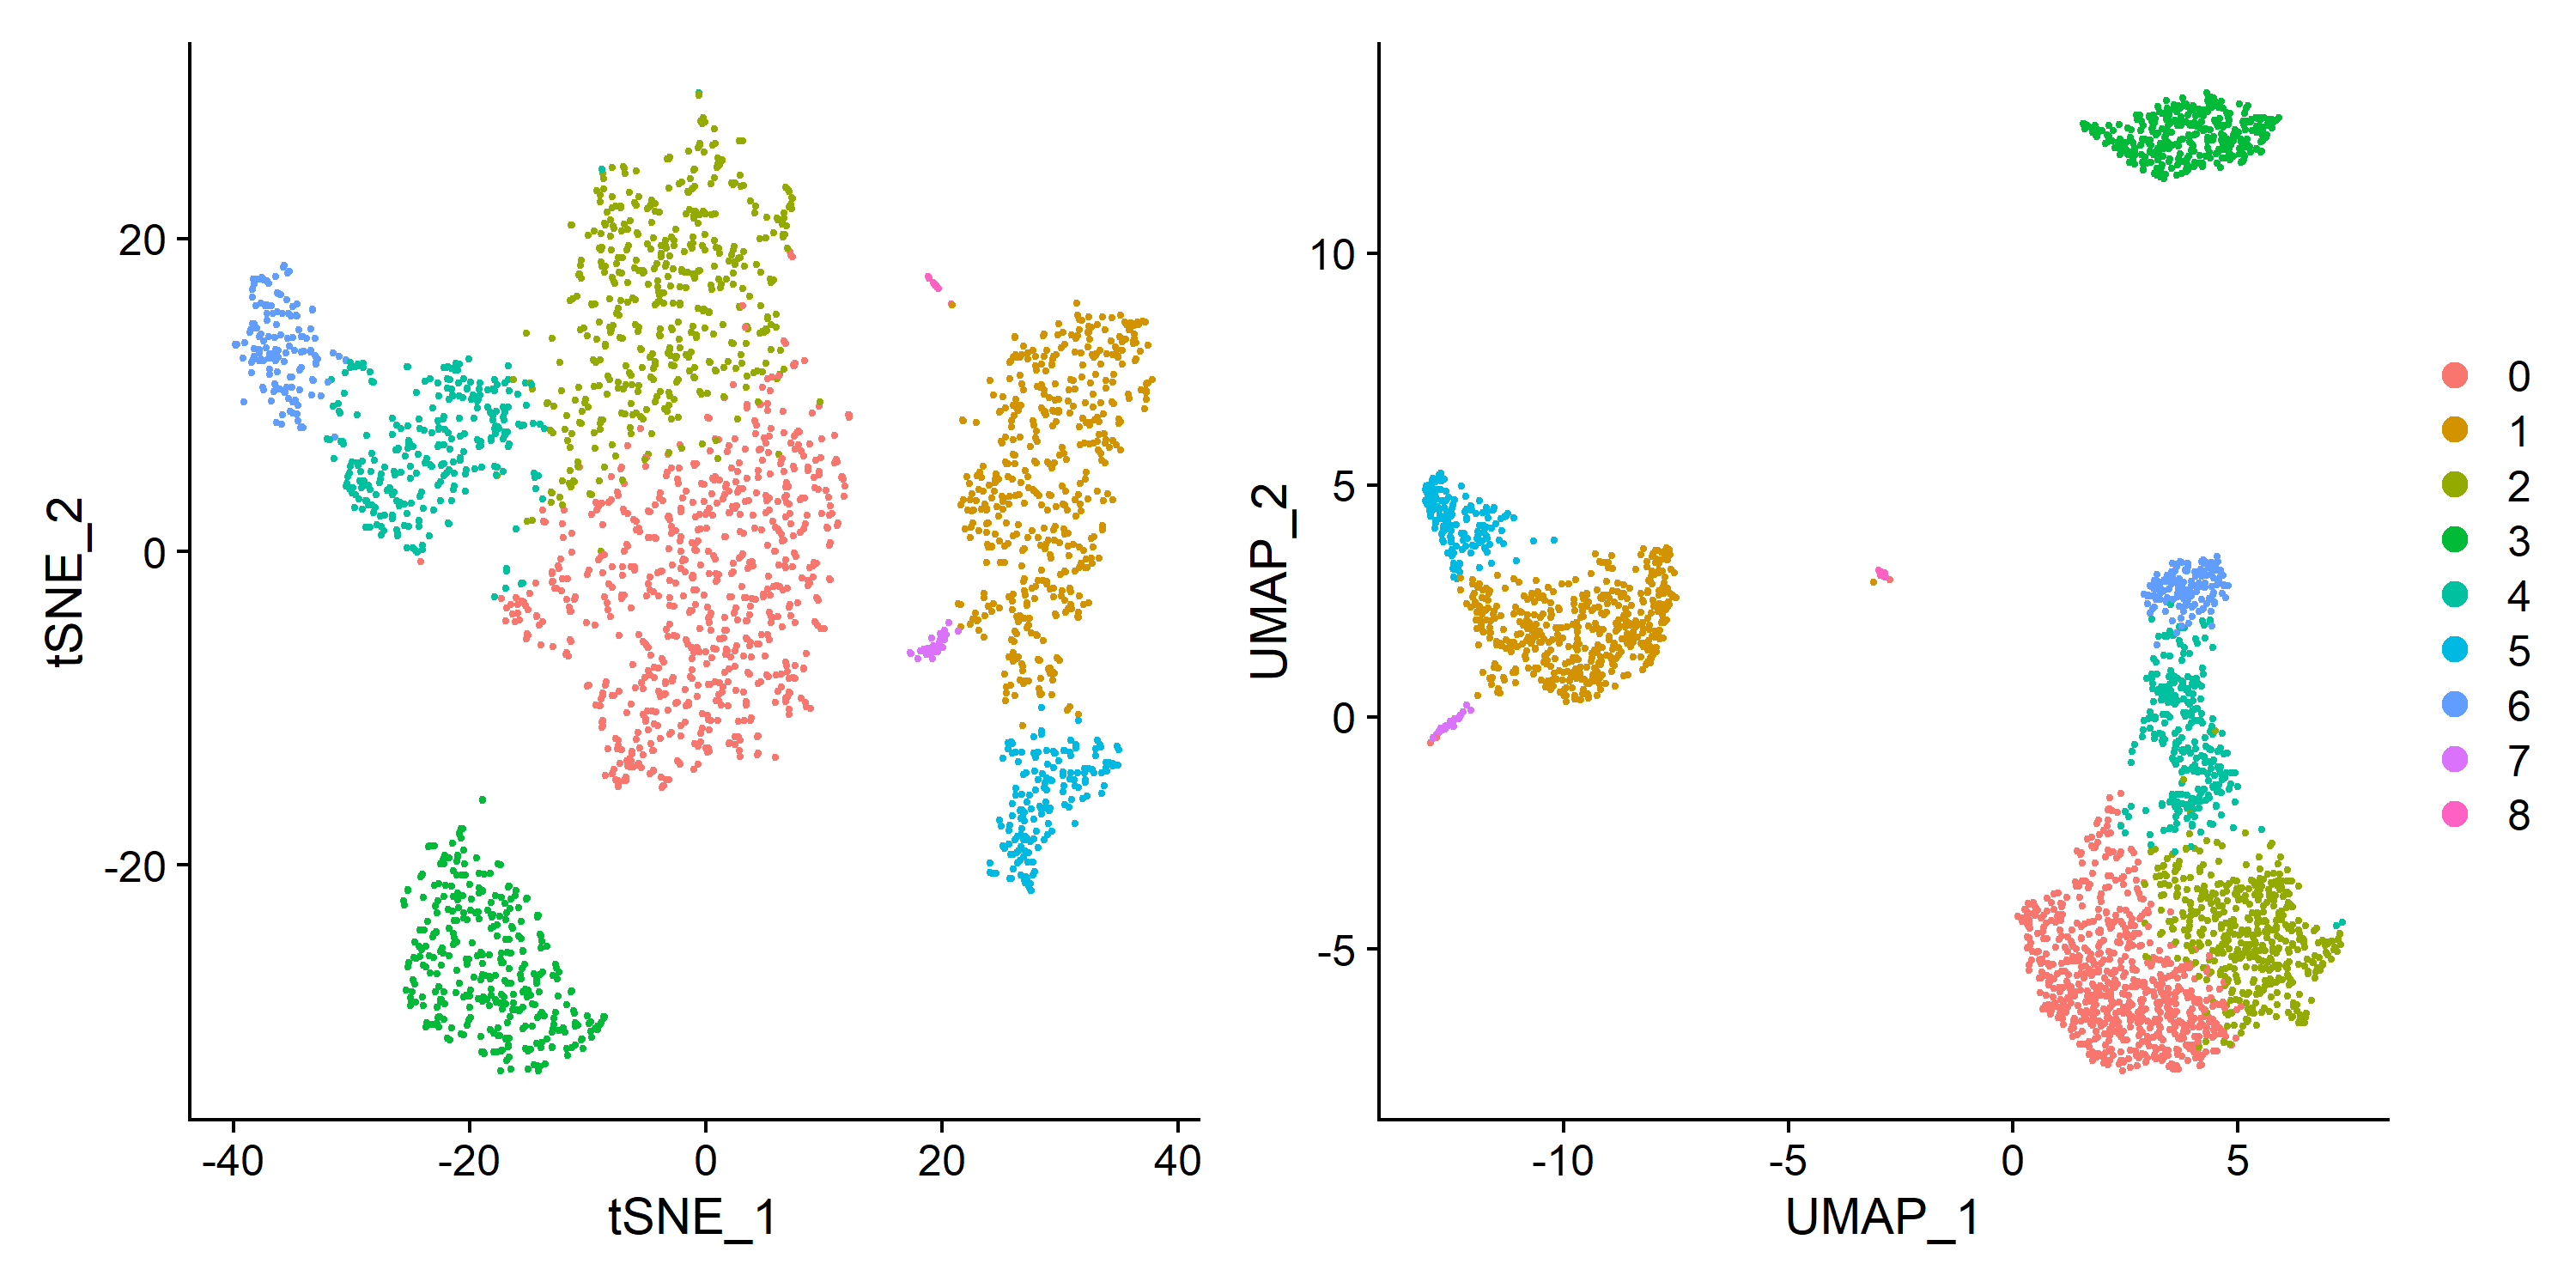
pbmc <- RunTSNE(pbmc, dims = pc.num)
embed_tsne <- Embeddings(pbmc, 'tsne')
write.csv(embed_tsne, 'cluster/embed_tsne.csv')
plot1 <- DimPlot(pbmc, reduction = 'tsne')
ggsave('cluster/tSNE.pdf', plot = plot1, width = 8, height = 7)
ggsave('cluster/tSNE.png', plot = plot1, width = 8, height = 7)
#UMAP
pbmc <- RunUMAP(pbmc, dims = pc.num)
embed_umap <- Embeddings(pbmc, 'umap')
write.csv(embed_umap, 'cluster/embed_umap.csv')
plot2 <- DimPlot(pbmc, reduction = 'umap')
ggsave('cluster/UMAP.pdf', plot = plot2, width = 8, height = 7)
ggsave('cluster/UMAP.png', plot = plot2, width = 8, height = 7)
plot <- plot1 + plot2 + plot_layout(guides = 'collect')
ggsave('cluster/tSNE_UMAP.pdf', plot = plot, width = 10, height = 5)
ggsave('cluster/tSNE_UMAP.png', plot = plot, width = 10, height = 5)
|

保存数据
1
| saveRDS(pbmc, file = 'pbmc_tutorial.rds')
|
Cluster标志基因
1
| dir.create('cell_identify')
|
默认使用wilcox方法鉴定标志基因,可以通过test.use参数设置分析方法。MASK是专门针对单细胞数据差异分析设计的,DESeq2是传统bulkRNA数据差异分析的经典方法。如果选用 “negbinom”、”poisson”或”DESeq2”等方法,需要将slot参数设为”counts”。
1
2
3
4
5
6
| wilcox.markers <- FindAllMarkers(pbmc, min.pct = 0.25, logfc.threshold = 0.25)
pbmc.markers <- wilcox.markers %>% select(gene, everything()) %>% subset(p_val < 0.05)
top10 <- pbmc.markers %>% group_by(cluster) %>% top_n(n = 10, wt = avg_log2FC)
write.csv(pbmc.markers, 'cell_identify/wilcox_markers.csv', row.names = F)
write.csv(top10, 'cell_identify/top10_wilcox_markers.csv', row.names = F)
|
挑选标志基因可视化其在各个cluster内的分布
1
2
3
4
5
6
7
8
9
10
11
12
13
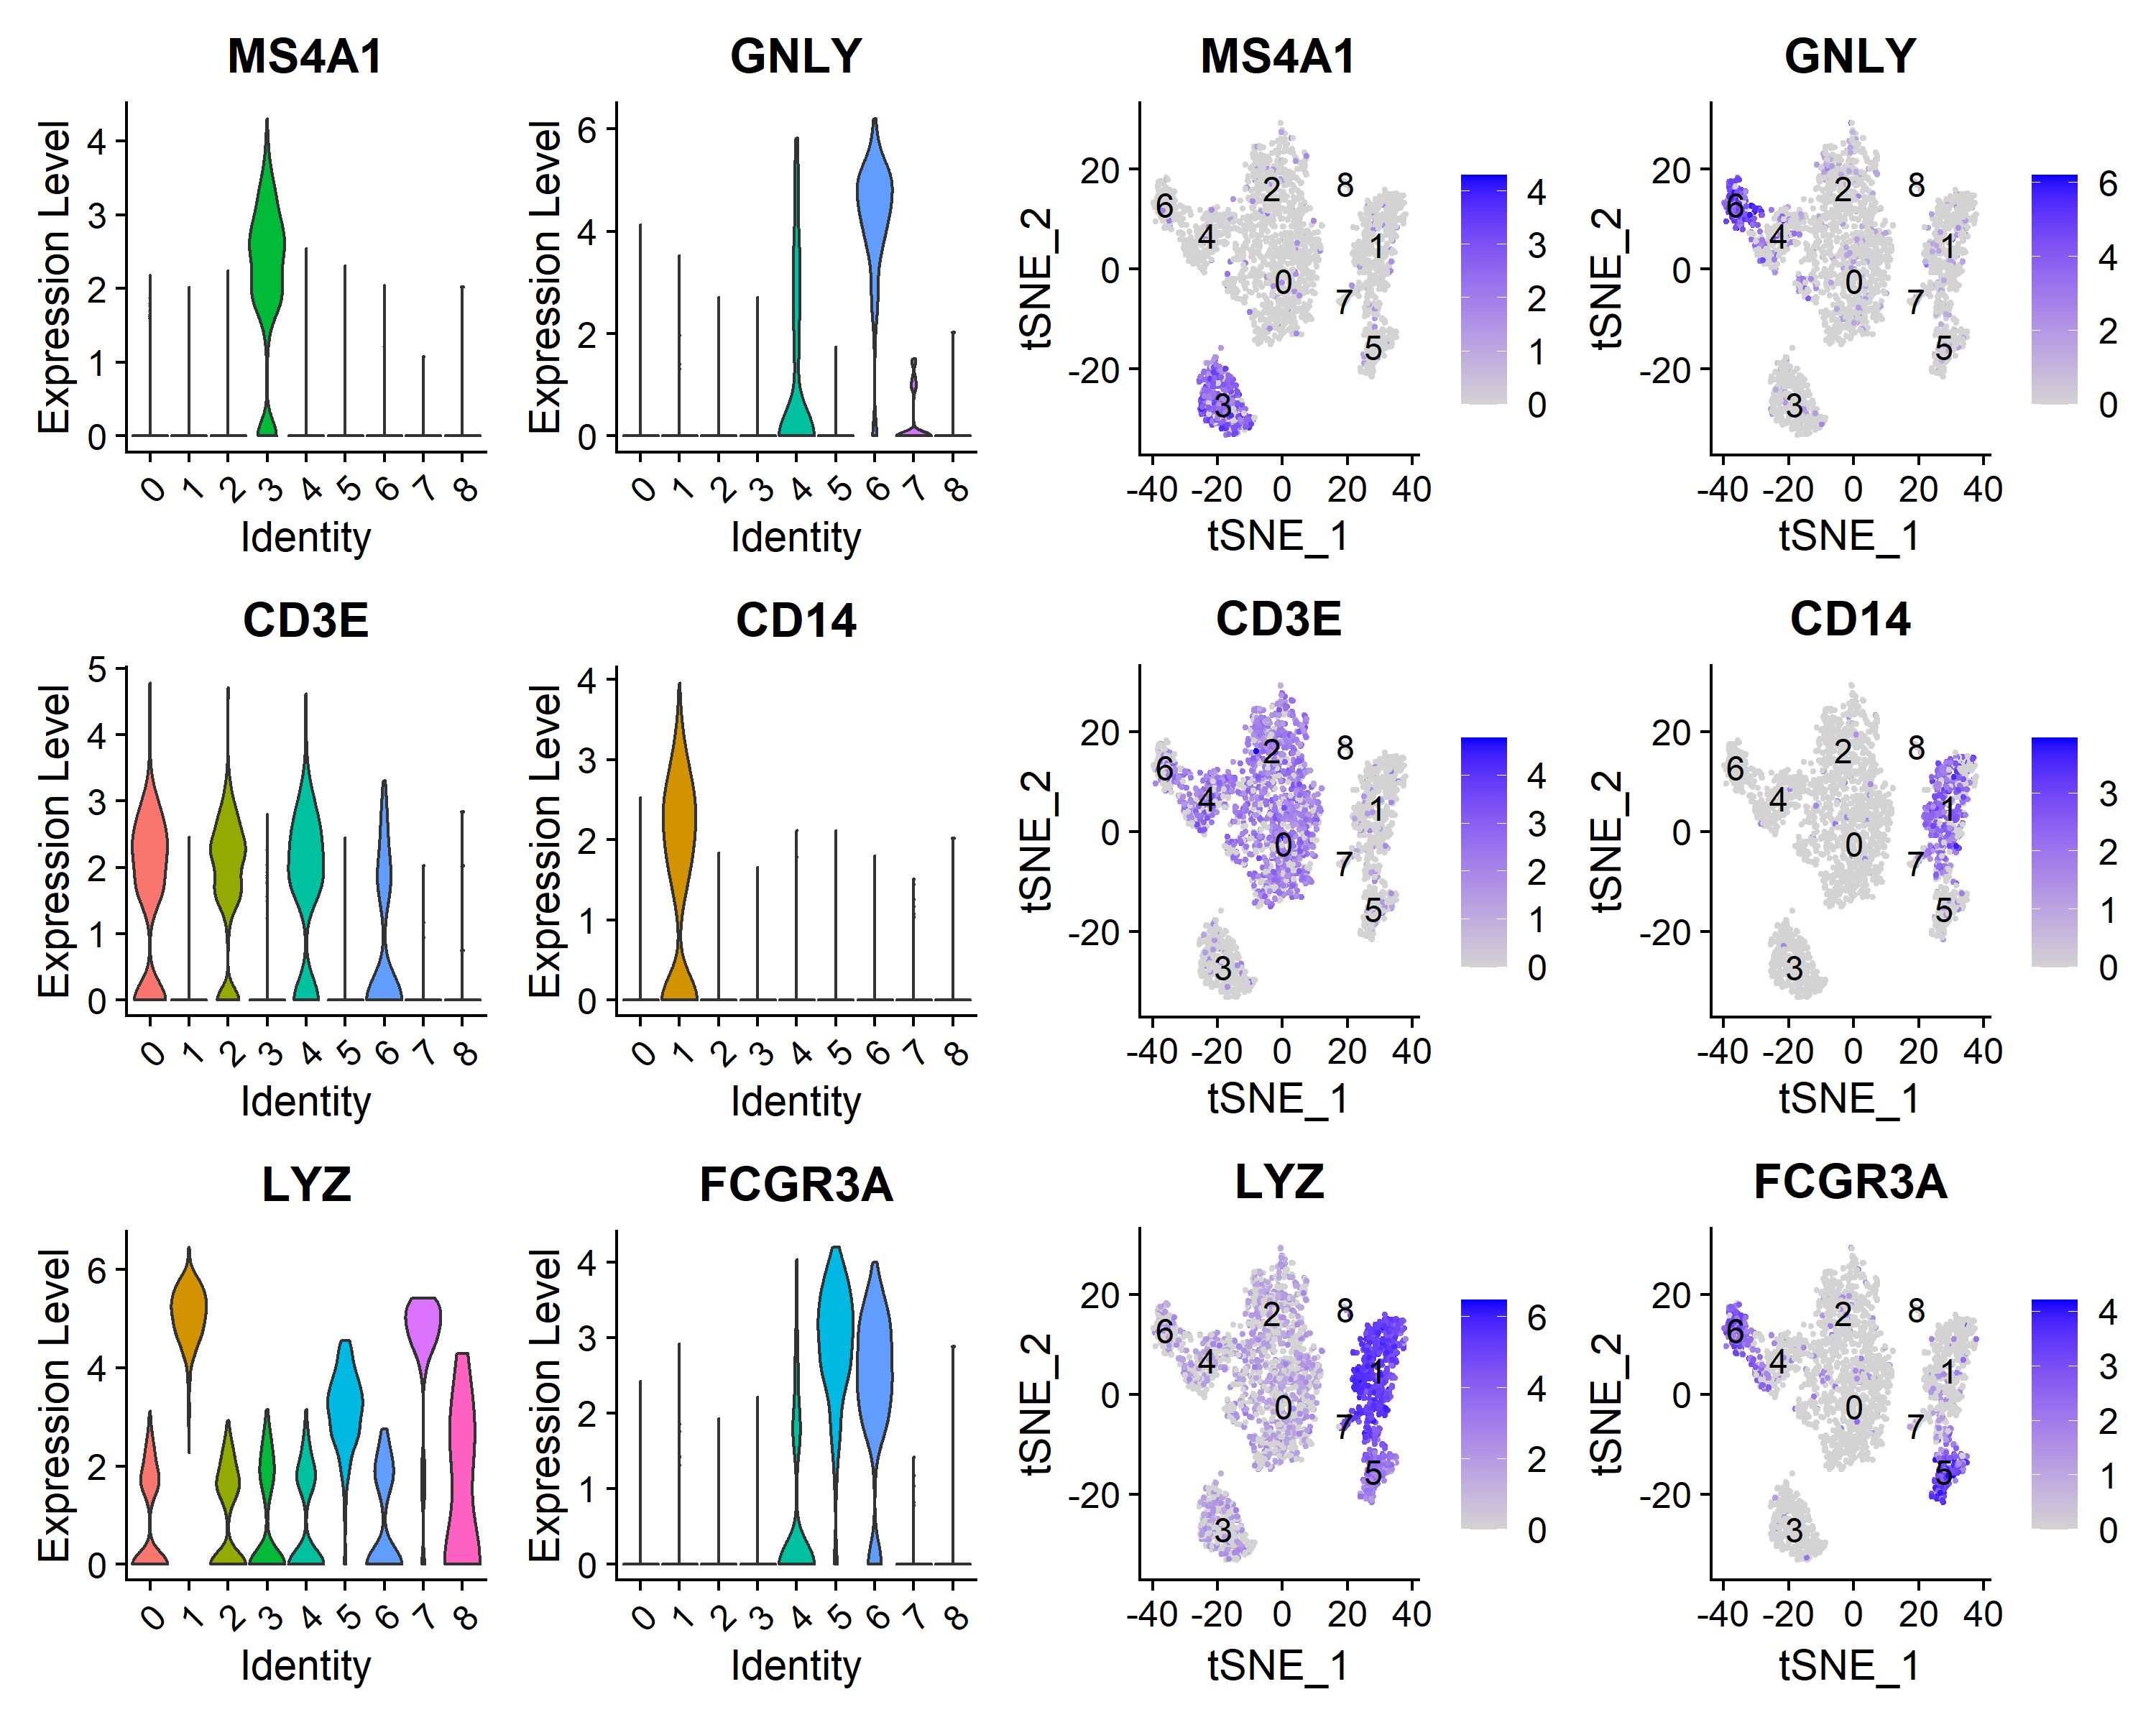
| select_genes <- c('MS4A1', 'GNLY', 'CD3E', 'CD14', 'LYZ', 'FCGR3A')
plot1 <- VlnPlot(pbmc, features = select_genes, pt.size = 0, ncol = 2)
ggsave('cell_identify/selectgenes_VlnPlot.pdf', plot = plot1, width = 6, height = 8)
ggsave('cell_identify/selectgenes_VlnPlot.png', plot = plot1, width = 6, height = 8)
plot2 <- FeaturePlot(pbmc, features = select_genes, reduction = 'tsne', label = T, ncol = 2)
ggsave('cell_identify/selectgenes_FeaturePlot.pdf', plot = plot2, width = 8, height = 12)
ggsave('cell_identify/selectgenes_FeaturePlot.png', plot = plot2, width = 8, height = 12)
plot <- plot1 | plot2
ggsave('cell_identify/selectgenes.pdf', plot = plot, width = 10, height = 8)
ggsave('cell_identify/selectgenes.png', plot = plot, width = 10, height = 8)
|

鉴定细胞类型
自动注释
1
2
3
4
5
6
7
8
9
10
11
| library(SingleR)
library(celldex)
refdata <- HumanPrimaryCellAtlasData()
testdata <- GetAssayData(pbmc, slot = 'data')
clusters <- pbmc@meta.data$seurat_clusters
cellpred <- SingleR(test = testdata, ref = refdata, labels = refdata$label.main, method = 'cluster', clusters = clusters, assay.type.test = 'logcounts', assay.type.ref = 'logcounts')
celltype <- data.frame(ClusterID = rownames(cellpred), celltype = cellpred$labels, stringsAsFactors = F)
write.csv(celltype, 'cell_identify/celltype_SingleR.csv', row.names = F)
pbmc@meta.data$celltype <- celltype[match(clusters, celltype$ClusterID), 'celltype']
|
1
2
3
4
5
6
7
8
9
10
11
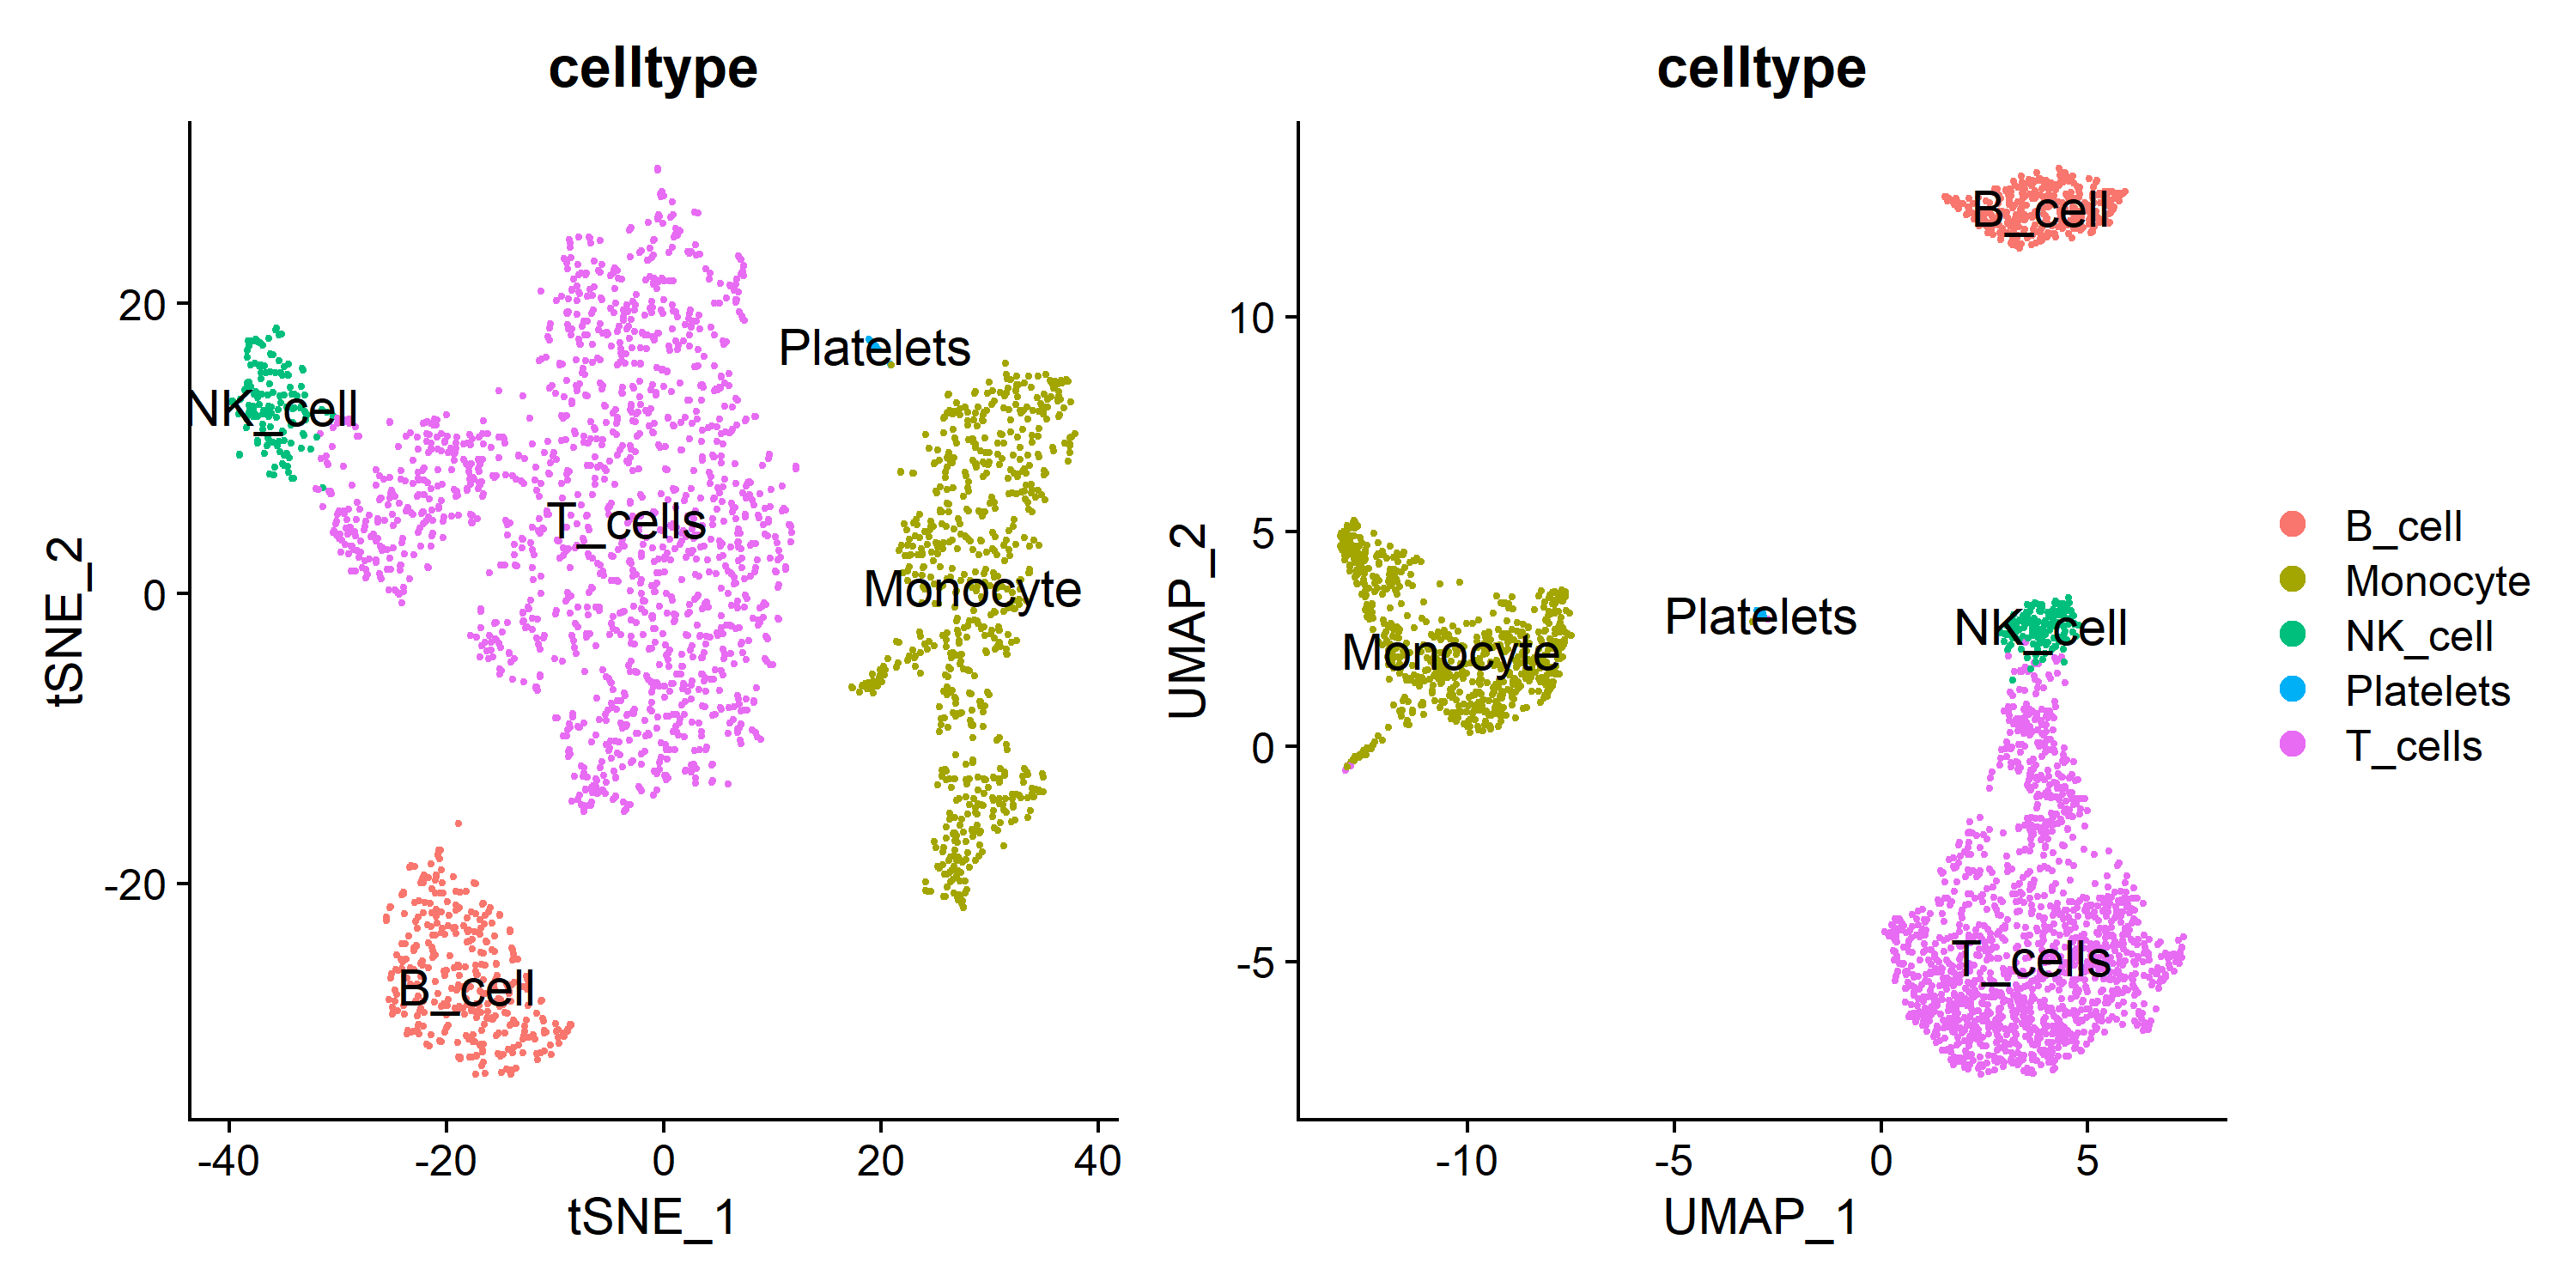
| plot1 <- DimPlot(pbmc, group.by = 'celltype', label = T, label.size = 5, reduction = 'tsne')
ggsave('cell_identify/SingleR_tSNE_celltype.pdf', plot = plot1, width = 7, height = 6)
ggsave('cell_identify/SingleR_tSNE_celltype.png', plot = plot1, width = 7, height = 6)
plot2 <- DimPlot(pbmc, group.by = 'celltype', label = T, label.size = 5, reduction = 'umap')
ggsave('cell_identify/SingleR_UMAP_celltype.pdf', plot = plot2, width = 7, height = 6)
ggsave('cell_identify/SingleR_UMAP_celltype.png', plot = plot2, width = 7, height = 6)
plot <- plot1 + plot2 + plot_layout(guides = 'collect')
ggsave('cell_identify/SingleR_celltype.pdf', plot = plot, width = 10, height = 5)
ggsave('cell_identify/SingleR_celltype.png', plot = plot, width = 10, height = 5)
|

根据先验知识手动注释细胞类型
1
2
3
4
5
6
7
8
9
10
11
12
13
14
15
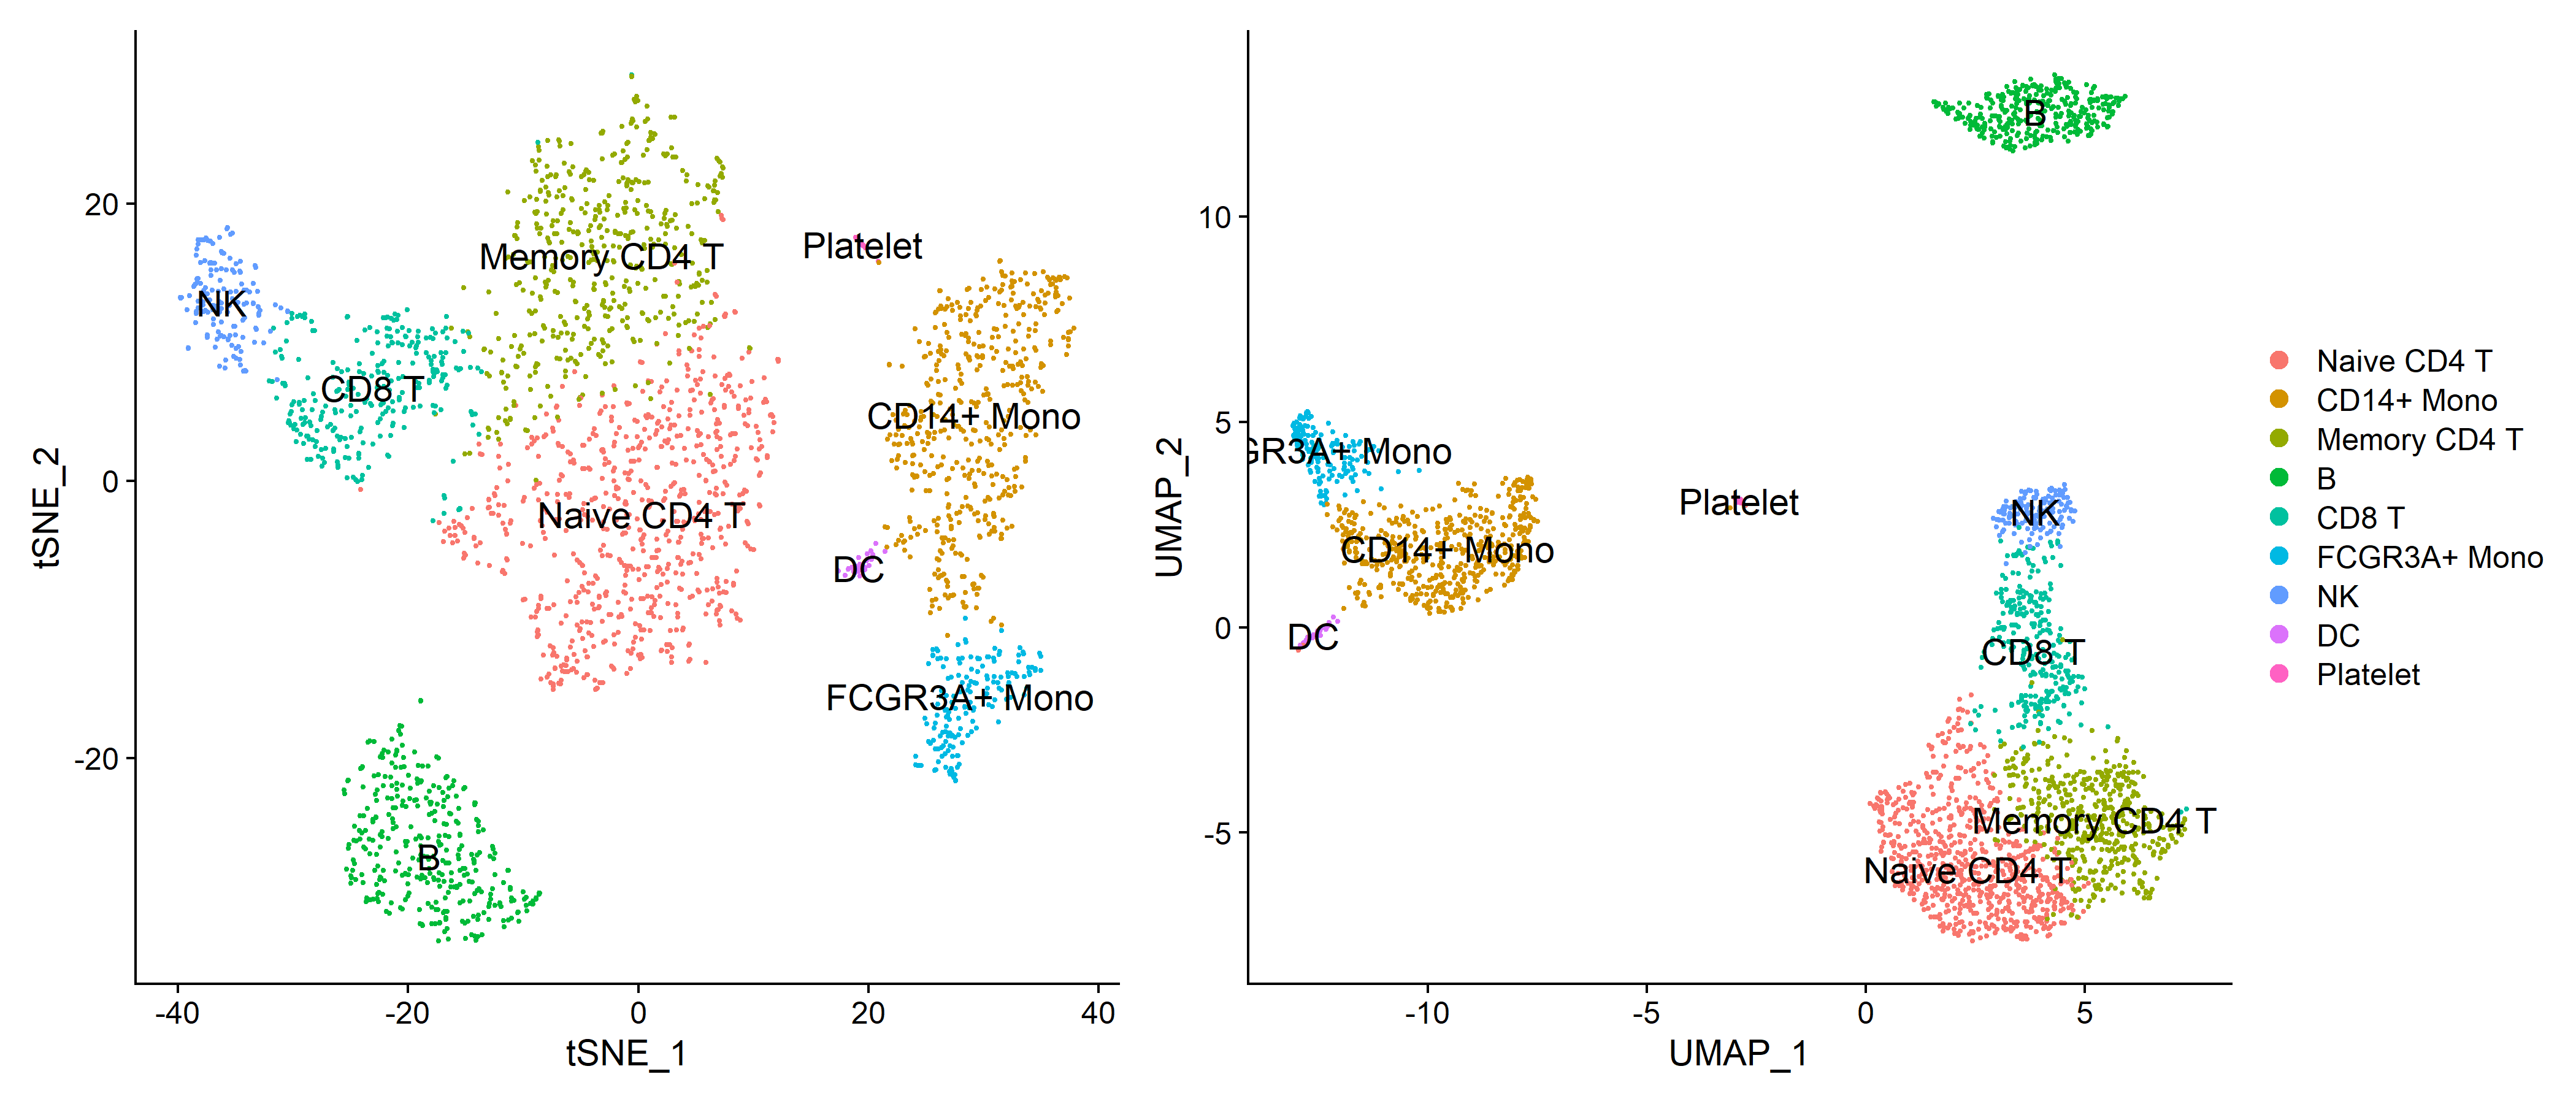
| new.cluster.ids <- c("Naive CD4 T", "CD14+ Mono", "Memory CD4 T", "B", "CD8 T", "FCGR3A+ Mono", "NK", "DC", "Platelet")
names(new.cluster.ids) <- levels(pbmc)
pbmc <- RenameIdents(pbmc, new.cluster.ids)
plot1 <- DimPlot(pbmc, label = T, label.size = 5, reduction = 'tsne')
ggsave('cell_identify/tSNE_celltype.pdf', plot = plot1, width = 7, height = 6)
ggsave('cell_identify/tSNE_celltype.png', plot = plot1, width = 7, height = 6)
plot2 <- DimPlot(pbmc, label = T, label.size = 5, reduction = 'umap')
ggsave('cell_identify/UMAP_celltype.pdf', plot = plot2, width = 7, height = 6)
ggsave('cell_identify/UMAP_celltype.png', plot = plot2, width = 7, height = 6)
plot <- plot1 + plot2 + plot_layout(guides = 'collect')
ggsave('cell_identify/celltype.pdf', plot = plot, width = 14, height = 6)
ggsave('cell_identify/celltype.png', plot = plot, width = 14, height = 6)
|

参考资料
Seurat - Guided Clustering Tutorial
单细胞转录组基础分析
