绘制好看的图片非常重要。可视化也是与听众交流数据见解时的核心,在那种情况下,借助图片吸引观众的注意力就更有必要了
Matplotlib是高度可定制的,但是很难根据目标找到需要修改的参数。Seaborn有一系列定制的主题,也有一个高水平的界面,用于美化matplotlib图像
1 | import numpy as np |
定义一个绘制一系列正弦曲线的函数,用来感受调节不同风格参数产生的影响
1 | def sinplot(flip=1): |
使用matplotlib默认参数绘制的图像如下:
1 | sinplot() |
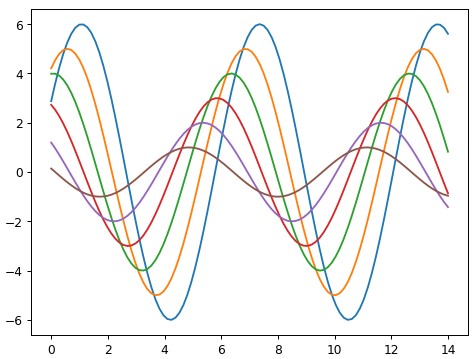
切换到seaborn默认风格只需要调用set_theme()函数:
1 | sns.set_theme() |
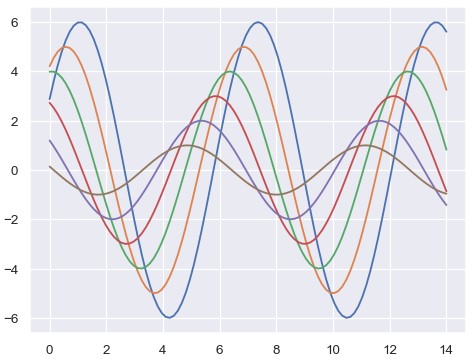
(注意,0.8版本之前的seaborn在导入包的同时自动调用set_theme(),但之后的版本需要显式地调用)
Seaborn把matplotlib参数划分成两个独立的组。第一组设置图片的美学风格,第二组缩放图中的各个元素,使它们便于应用到不同的情境 (context)
调整这些参数的界面是两对函数。axes_style()和set_style()控制风格,plotting_context()和set_context()缩放图片。这两对函数中的第一个函数返回一个参数的字典,第二个函数调整matplotlib默认参数
Seaborn图片风格
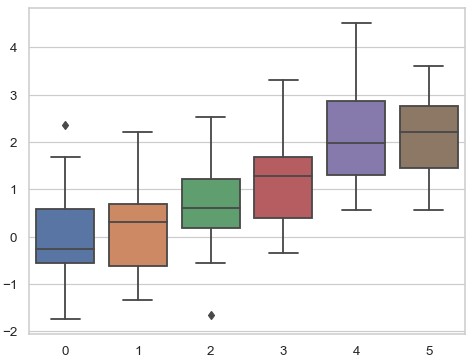
有五种预设的seaborn主题:darkgrid,whitegrid,dark,white,ticks。默认主题是darkgrid。正如上面提到的那样,网格有助于在图上查找定量信息,白灰配色可以避免网格与代表数据的线条发生混淆。whitegrid主题也是类似的,但是更适用于有大量数据元素的图:
1 | sns.set_style('whitegrid') |
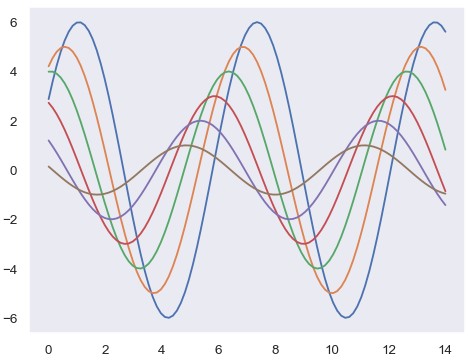
对很多图来说 (尤其是在talk之类的情境下,你主要想利用图片展示数据模式的一个印象),网格就不那么必要了:
1 | sns.set_theme('dark') |
1 | sns.set_theme('white') |
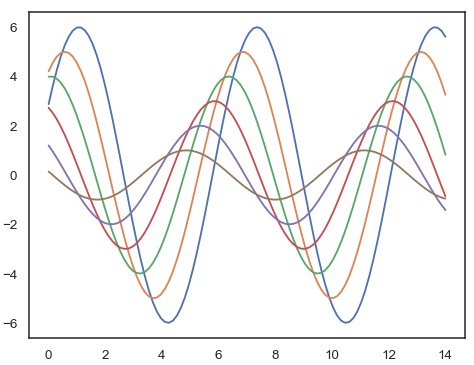
有时候需要在坐标轴上添加刻度:
1 | sns.set_theme('ticks') |
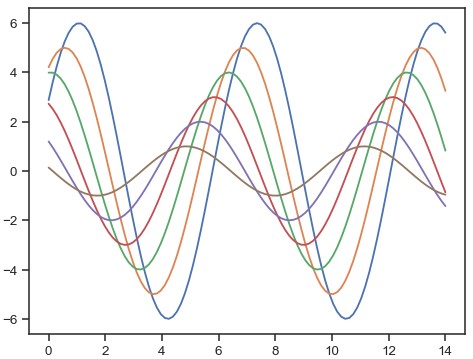
去除坐标轴线
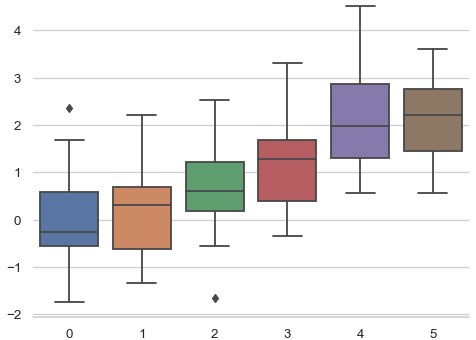
white和ticks风格都不需要上方及右侧的坐标轴线,调用despine()可以把它们去除:
1 | sinplot() |
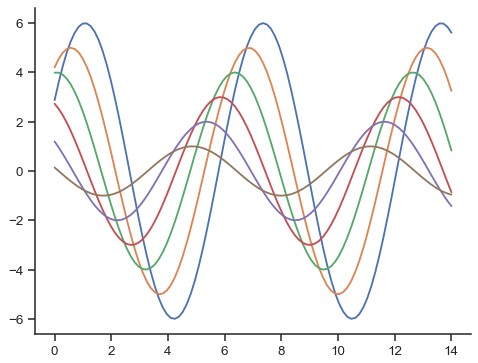
有些图需要坐标轴线离数据线条远一点,也可以调用despine()实现。如果刻度并不覆盖整个坐标轴范围,可以使用trim参数加以限制:
1 | f, ax = plt.subplots() |
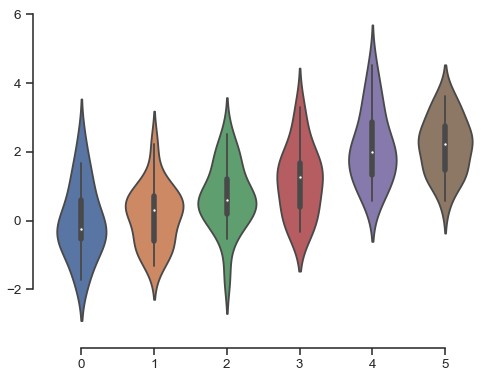
也可以使用despine()的参数指定移除哪一条坐标轴线:
1 | sns.set_theme('whitegrid') |
局部设置图片风格
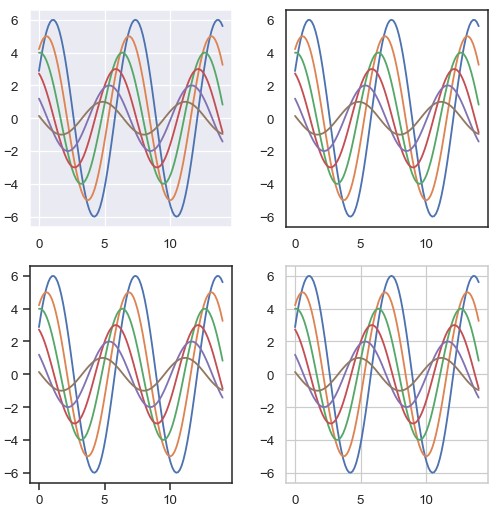
虽然来回切换也很方便,也可以在with声明中使用set_style()临时设置绘图参数。这样也能够在图中绘制不同风格的轴”
1 | f = plt.figure(figsize=(6, 6)) |
重写seaborn风格中的元素
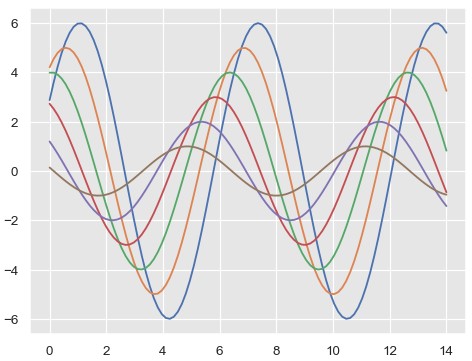
要想自定义seaborn风格,可以向axes_style()和set_style()的rc参数传递一个字典。注意,这种方法只能重写风格定义中已有的参数 (高层次的set_theme()函数可以接受包含所有matplotlib参数的字典)
如果想知道都可以设置哪些参数,可以调用下面的这个函数,返回当前的设置:
1 | sns.axes_style() |
然后就可以把这些参数的值进行修改:
1 | sns.set_style('darkgrid', {'axes.facecolor': '0.9'}) |
控制绘图元素的尺寸
有一套单独的参数控制绘图元素的尺寸,无论想要大一点还是小一点的图,都可以用相同的代码进行绘制
首先调用set_theme()恢复默认参数:
1 | sns.set_theme() |
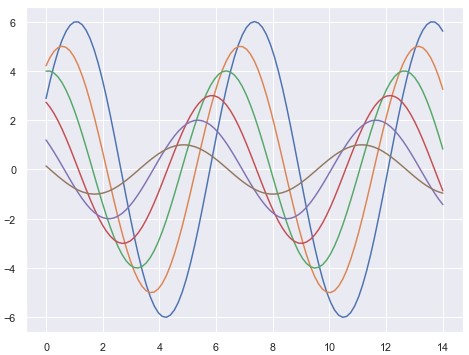
四种关于相对大小的预设情境分别是paper,notebook,talk,poster。默认风格是notebook,上面那些图使用的就是这种风格:
1 | sns.set_context('paper') |
1 | sns.set_context('talk') |
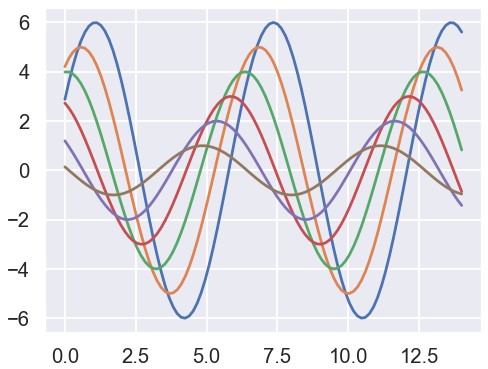
1 | sns.set_context('poster') |
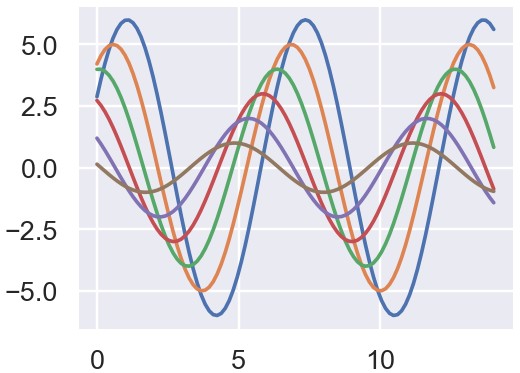
大多数已经介绍过的关于风格的函数都可以迁移到情境函数
可以在调用set_context()时使用预设的风格,也可以提供参数字典重写默认参数
可以在切换情境时单独修改字体的大小 (这一功能也可以通过顶层的set()函数实现):
1 | sns.set_context('notebook', font_scale=1.5, rc={'lines.linewidth': 2.5}) |
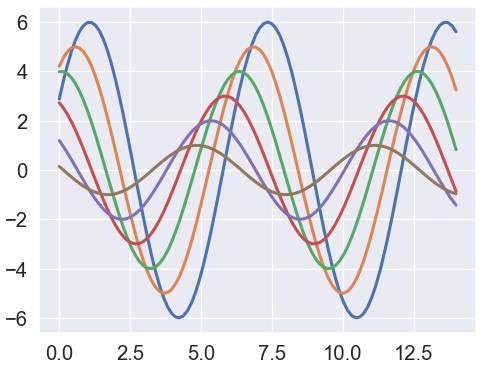
类似的,也可以在with声明下临时修改图片元素的尺寸
使用set()函数可以快速配置风格和情境。这个函数也可以设置默认调色板,将在下一章教程中详细介绍


